


Bicycle comfort has received a lot more attention in recent years, with an increasing number of companies developing products designed to make bikes more comfortable.
As a website that loves both comfort and data, we’ve spent a lot of time here at CYCLINGABOUT investigating, testing, measuring, and reviewing these products.
But Trek’s Performance Research Team has taken the science of bicycle comfort a step further. This group of biomechanical engineers, physiologists, and instrumentation specialists began building its dedicated research laboratory around 2018, creating a controlled environment to study how bicycles and their components interact with the rider.
Over several years, the team developed testing equipment, protocols, and analysis techniques to quantify what happens when a bicycle encounters rough terrain, and importantly, what happens to the rider as a result. The outcome is a fascinating body of research that provides new insights into what makes a bicycle comfortable.
In this article, we’ll look at how Trek’s research lab works, how it measures the interaction between bicycle and rider, and what its testing reveals. We’ll then examine data from two road bikes and three gravel bikes, including a fascinating comparison between a rigid and full-suspension gravel bike.
Let’s get into it!
What Is Bicycle Comfort?
Trek primarily defines bicycle comfort in terms of vibrational power: the amount of energy transmitted to the rider as they travel over a given surface. The less energy that reaches the rider at a given speed and surface condition, the more comfortable the ride.
This is also the principle behind the CYCLINGABOUT Comfort Lab, where we have measured the vibration-reducing performance of more than 50 products using a controlled obstacle.
At the rear of the bicycle, three key components determine how much vibration reaches the rider: the tyre, frame and seatpost. The seatpost, for example, can be designed with vertical compliance, allowing it to flex when the bike encounters bumps and reducing the vibration transmitted to the rider.
At the front, the equivalent components are the tyre, fork and handlebars. Like a compliant seatpost, the fork and handlebars can flex to absorb some of the vibration before it reaches the rider’s hands.
How Trek Measures the Rider and Bike Together
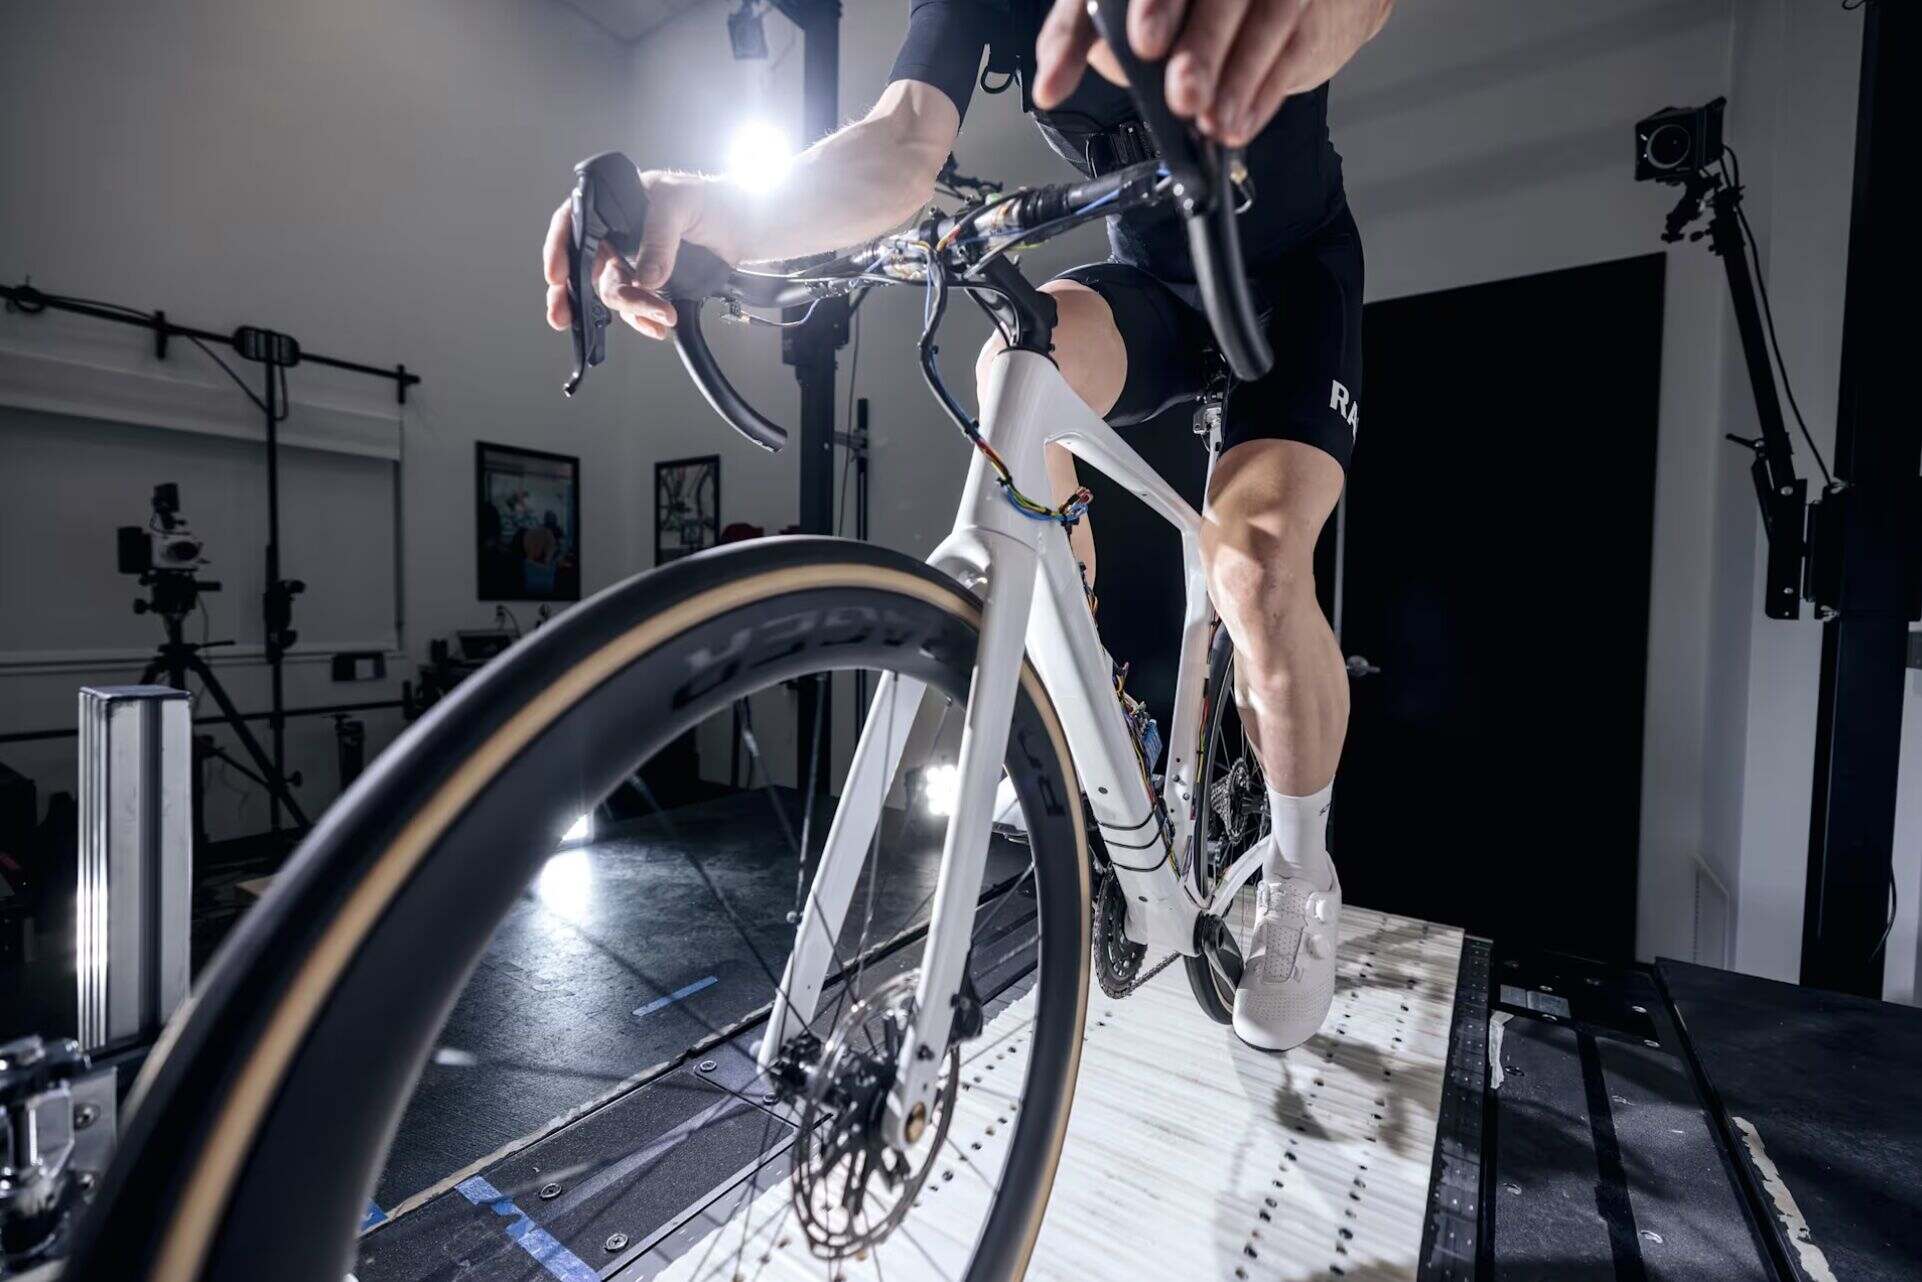
Trek ultimately designed its Performance Research Lab to study the interaction between rider and bicycle under realistic, dynamic loading.
When a bicycle hits a bump, for example, the rider may instinctively change how they interact with the bike by relaxing their elbows or slightly lifting themselves from the saddle. Trek can quantify this interaction by measuring the forces between the rider and bicycle at the three primary contact points.
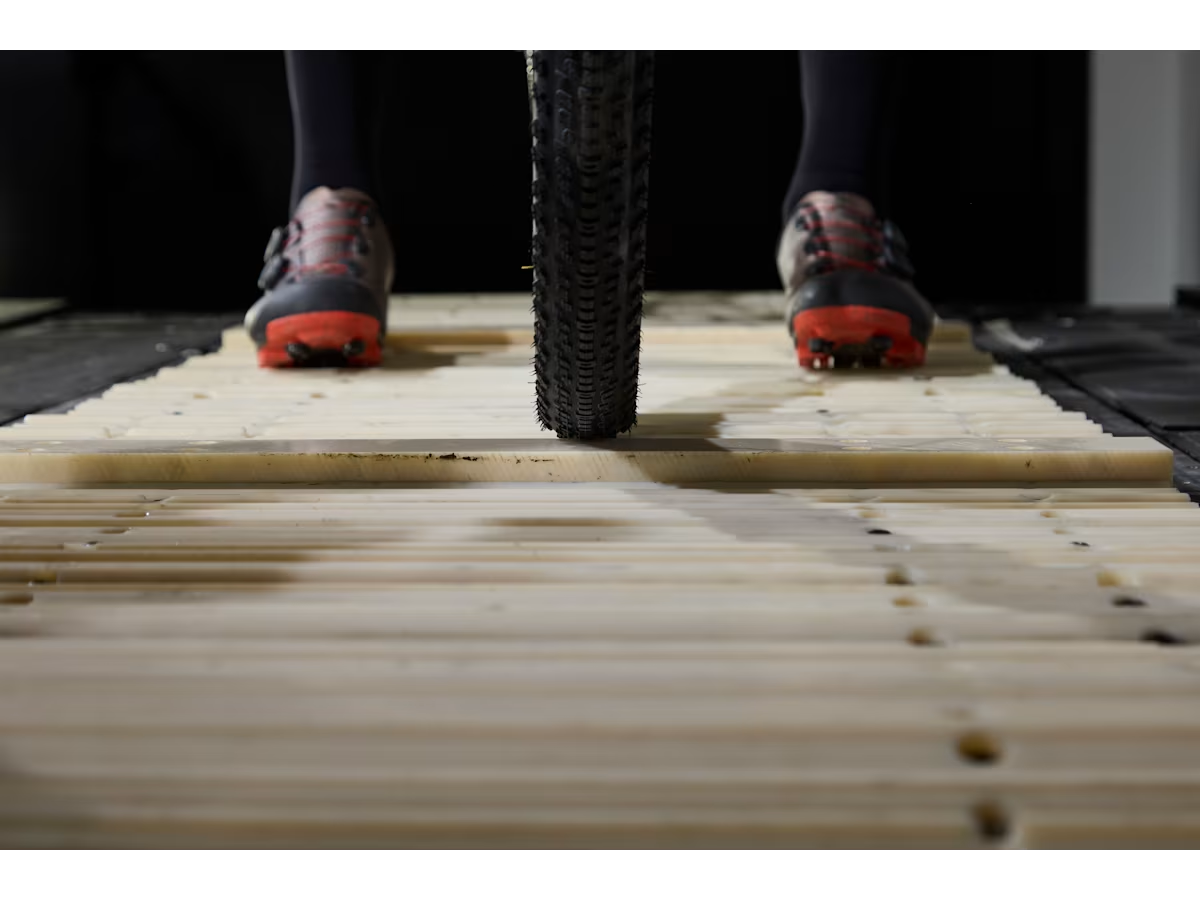
At the centre of the Performance Research Lab is a slat-based Woodway treadmill. Trek can attach different riding surfaces to the treadmill, allowing its engineers to reproduce controlled surface conditions while the rider pedals normally. This helps eliminate variables such as line choice while keeping speed and surface conditions consistent.
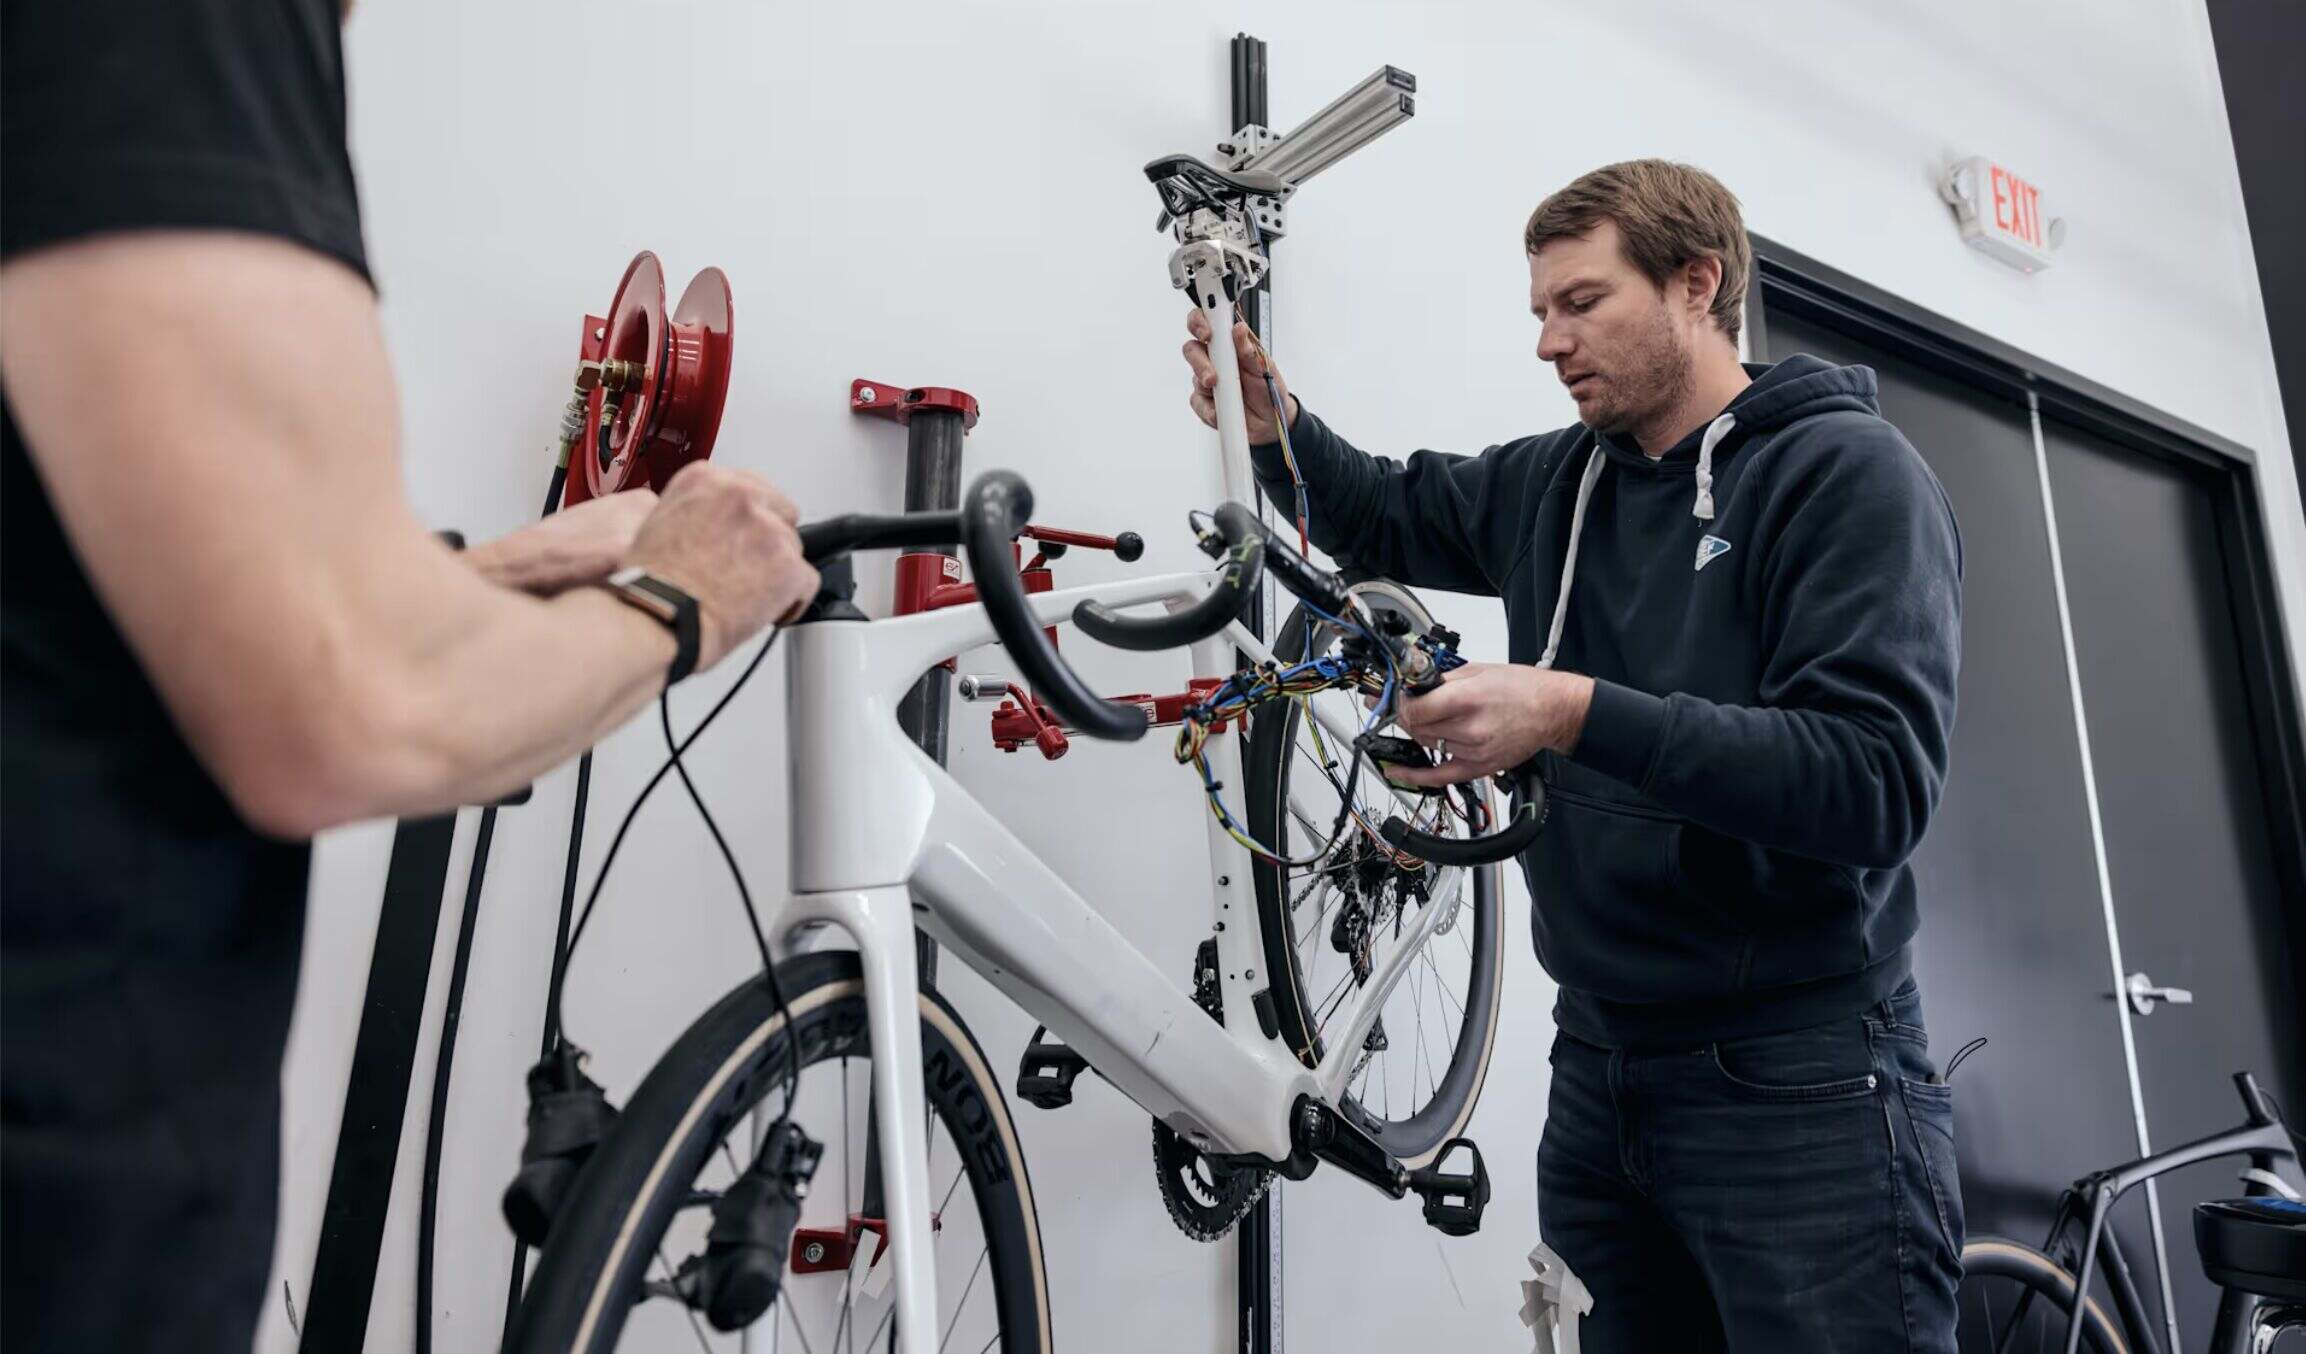
Trek instruments the bikes it tests with force-sensing saddles and handlebars. Strain gauges measure the forces transmitted through the saddle, left hand and right hand.
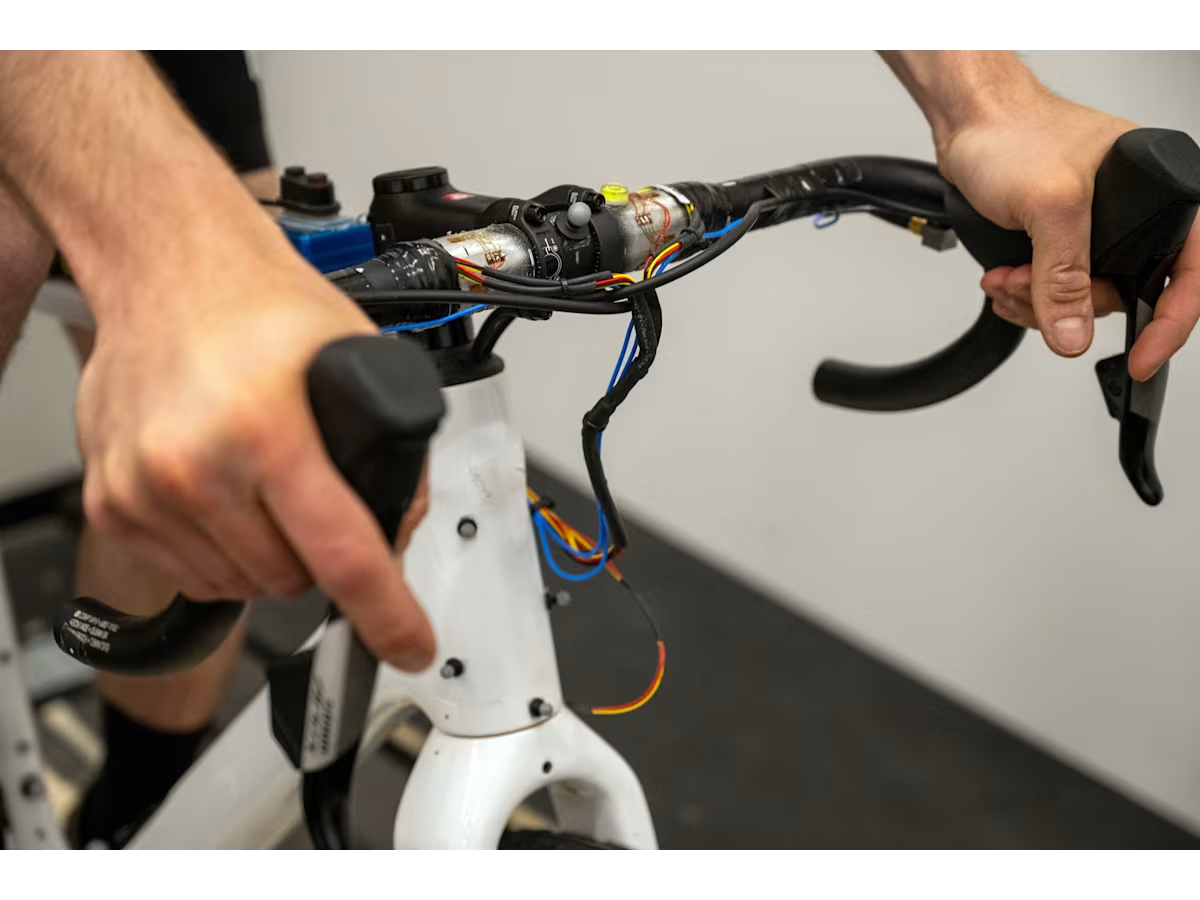
The current system measures these forces at more than 5,000 samples per second. Accelerometers at the same locations measure acceleration, which can then be integrated to determine velocity.
By combining force and velocity measurements, Trek can calculate the power being transferred through each contact point. This gives its engineers a quantitative measure of how much vibrational energy is reaching the rider.
Measuring Bike and Rider Motion
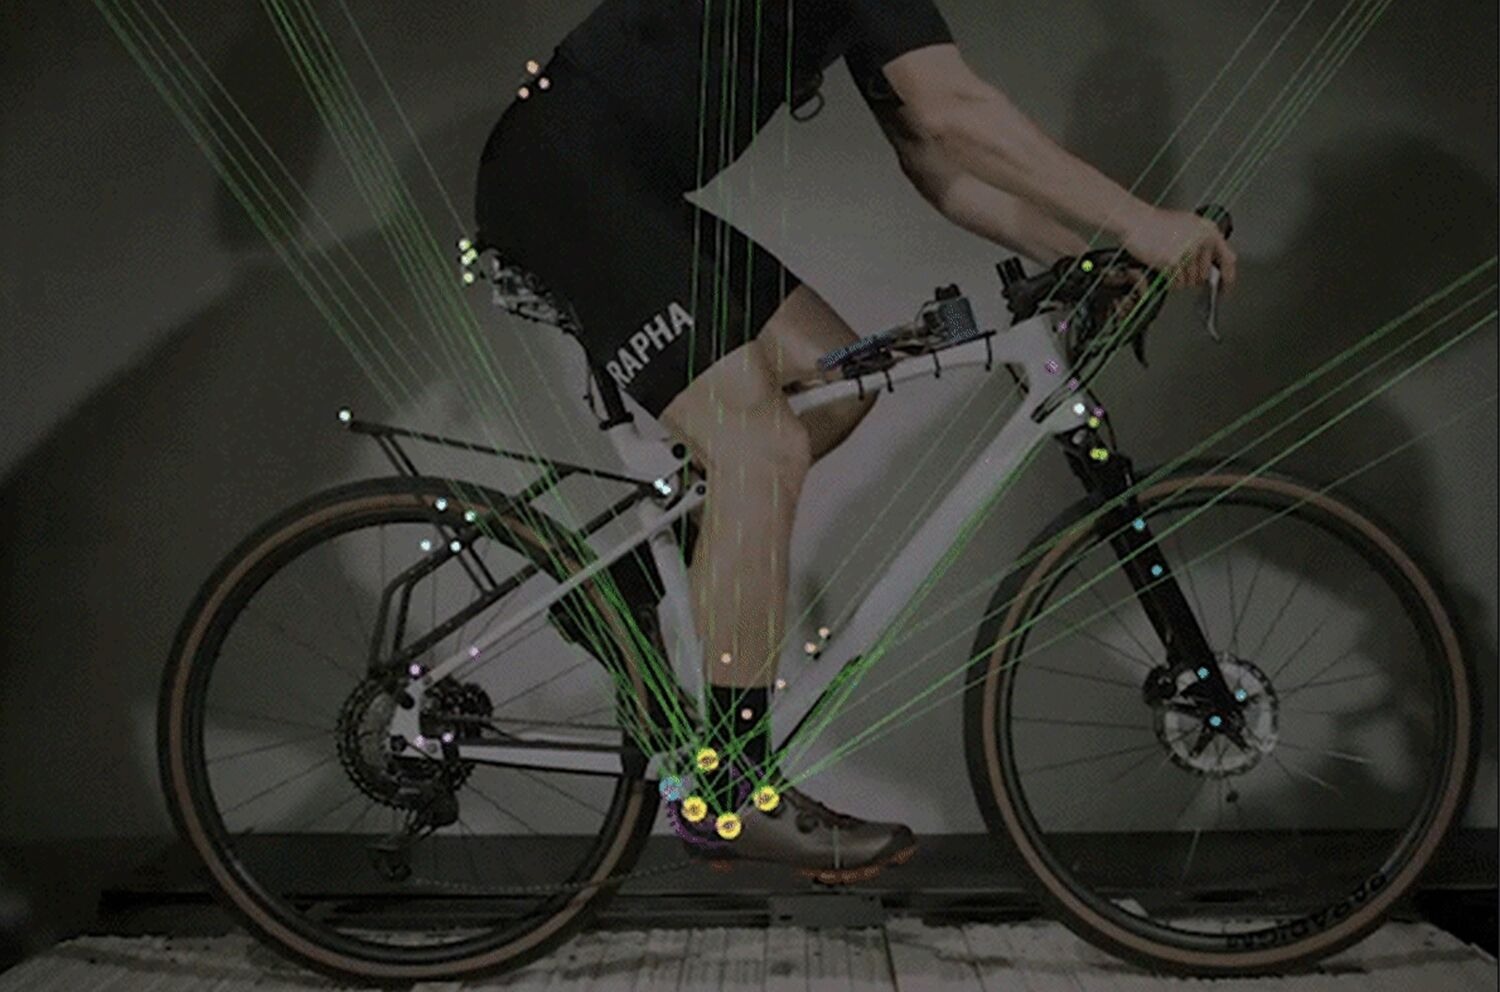
The way the bicycle and rider move in response to the terrain can provide another measure of comfort. According to Trek, comfort isn’t determined solely by how much the bicycle vibrates; it also depends on how strongly the rider is coupled to the bicycle.
To measure this interaction, Trek uses three-dimensional motion capture. Twelve OptiTrack infrared cameras track the movement of the rider and bicycle as they travel over the treadmill. Reflective markers are placed on different parts of the bicycle and rider, allowing Trek to measure how individual components respond to surface inputs in three-dimensional space.
Trek can then compare the movement of different parts of the system. Markers around the bottom bracket show how the bicycle responds to the terrain, while markers on the saddle and rider’s pelvis show how the rider responds to the bicycle.
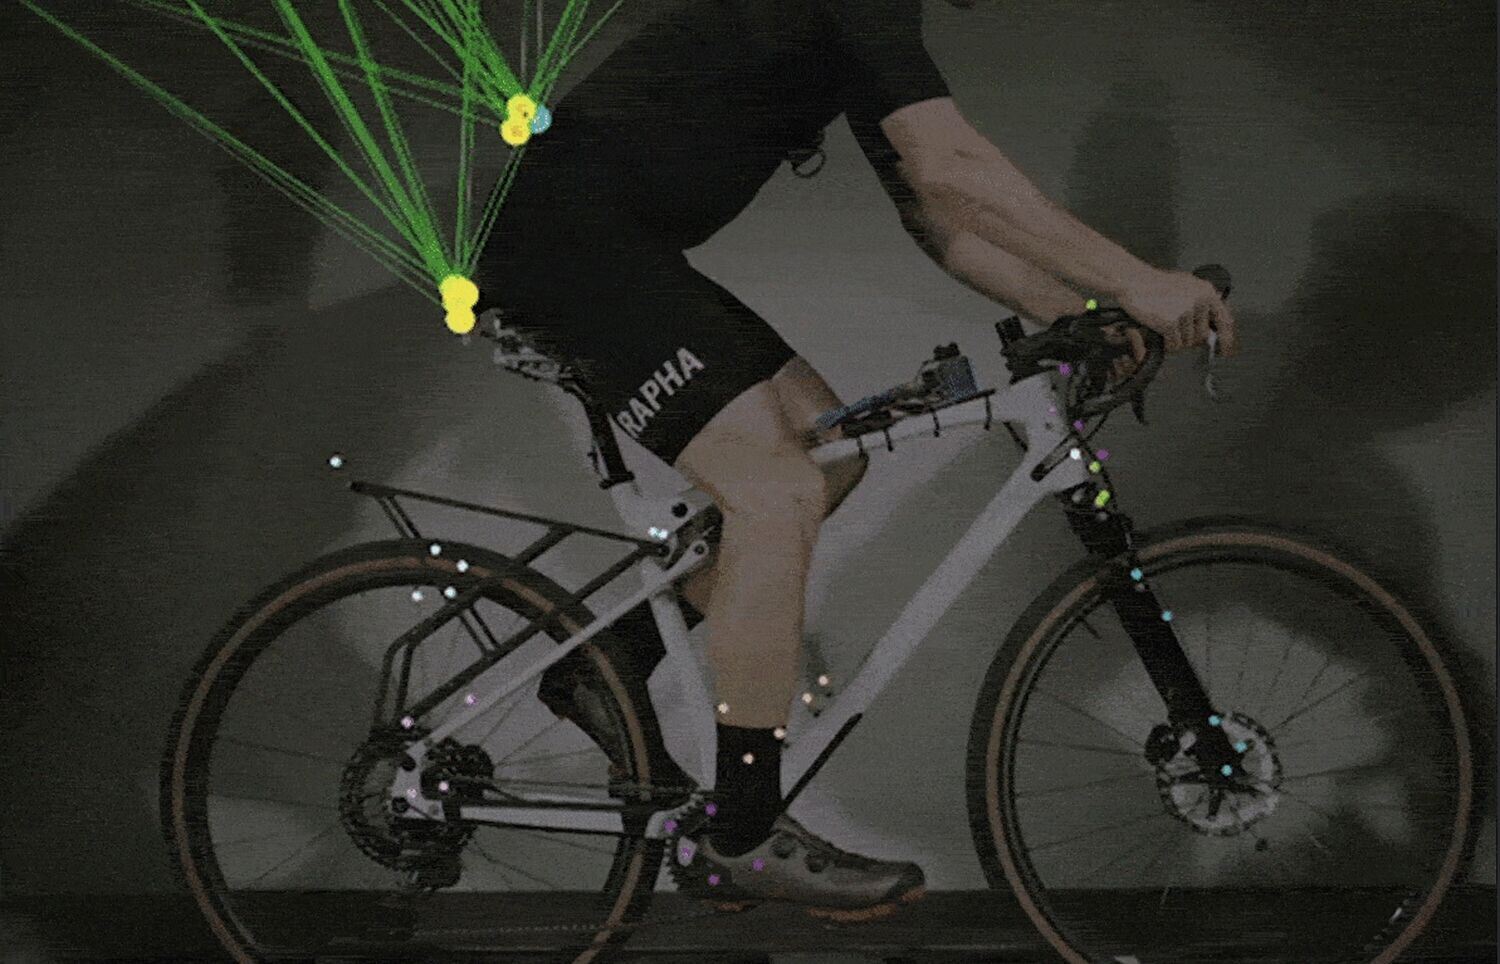
One particularly interesting relationship for Trek is between the pelvis and saddle. Trek uses markers around the rider’s sacrum (tailbone) and on the saddle to quantify this relationship.
A more comfortable bike allows the rider to remain planted on the saddle, with the sacrum and saddle moving together. In other words, even over rough terrain, the pelvis and saddle should remain relatively well coupled as the bicycle responds to the surface.
In comparison, a less comfortable bike may cause the rider to be bounced away from the saddle, or prompt them to deliberately hover slightly above it to reduce the impact. Both situations produce greater variation in the distance between the saddle and sacrum, indicating weaker coupling between the rider and bicycle. This is likely to result in a less comfortable ride that also requires more physical effort.
Treadmill Testing Two Road Bikes
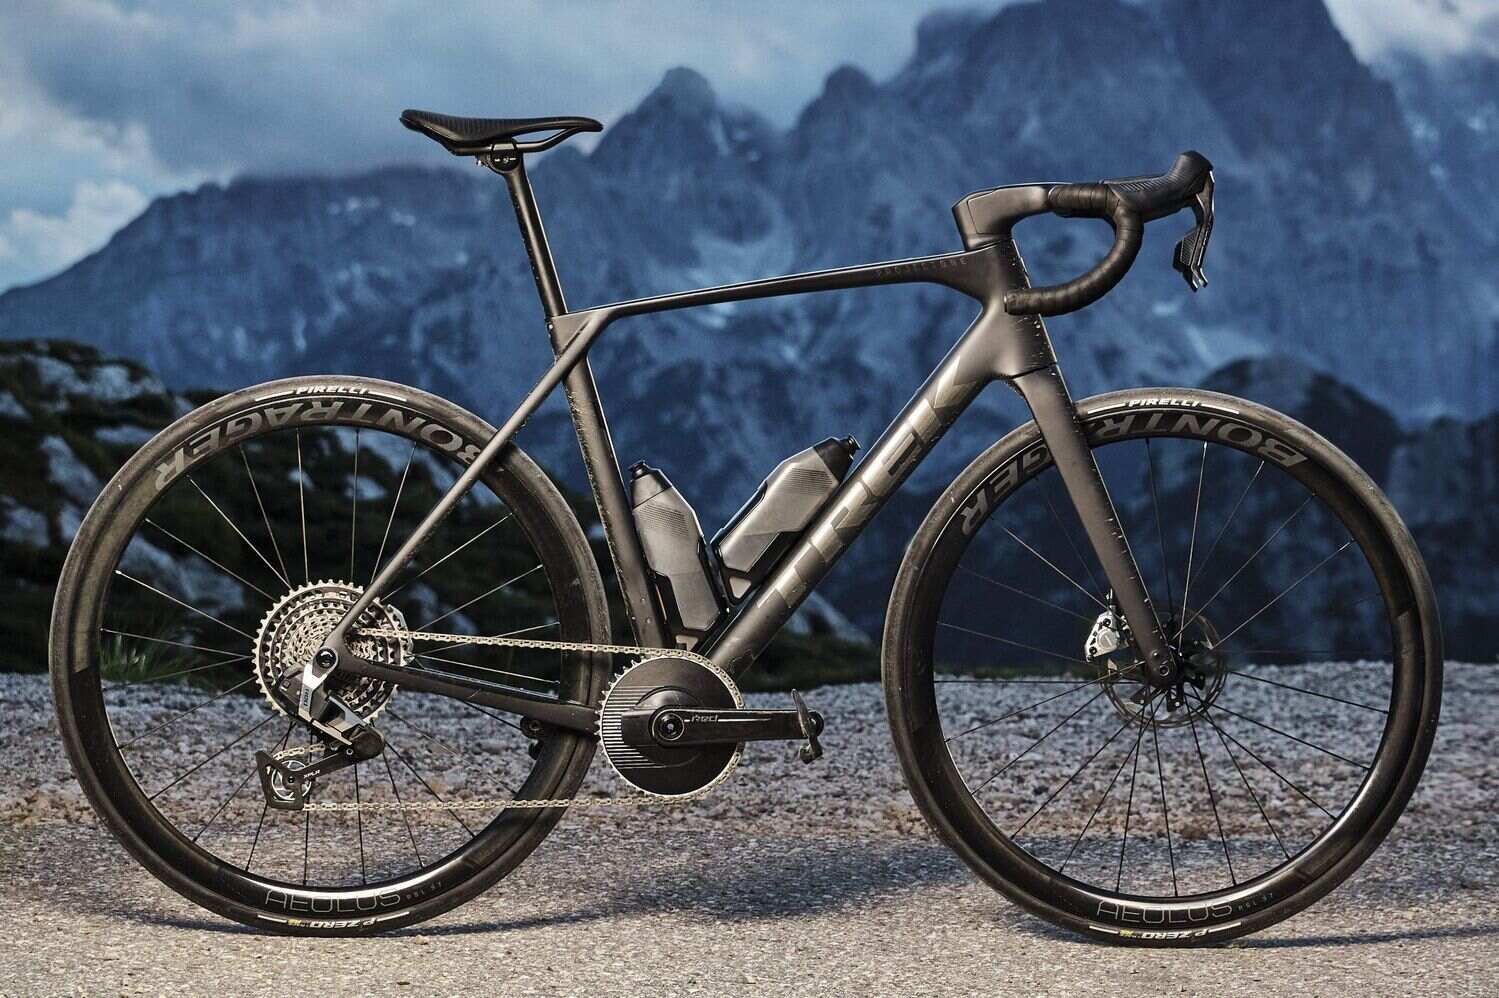
Let’s now look at how Trek applied this testing system to two generations of its Domane road bike.
A Trek Domane Gen 4 and Gen 5 were tested against each other at speeds ranging from 11 to 32 km/h (7–20 mph), while Trek also varied tyre pressure. This allowed the engineers to compare the two bikes across a range of realistic riding speeds and tyre pressures, while keeping the surface conditions controlled.
The older Gen 4 Domane uses Trek’s Isospeed system, a decoupled seatpost and seat tube that is designed to improve overall comfort by allowing the saddle to move vertically. The Gen 4 bike was tested with both 25mm and 32mm-wide tyres.
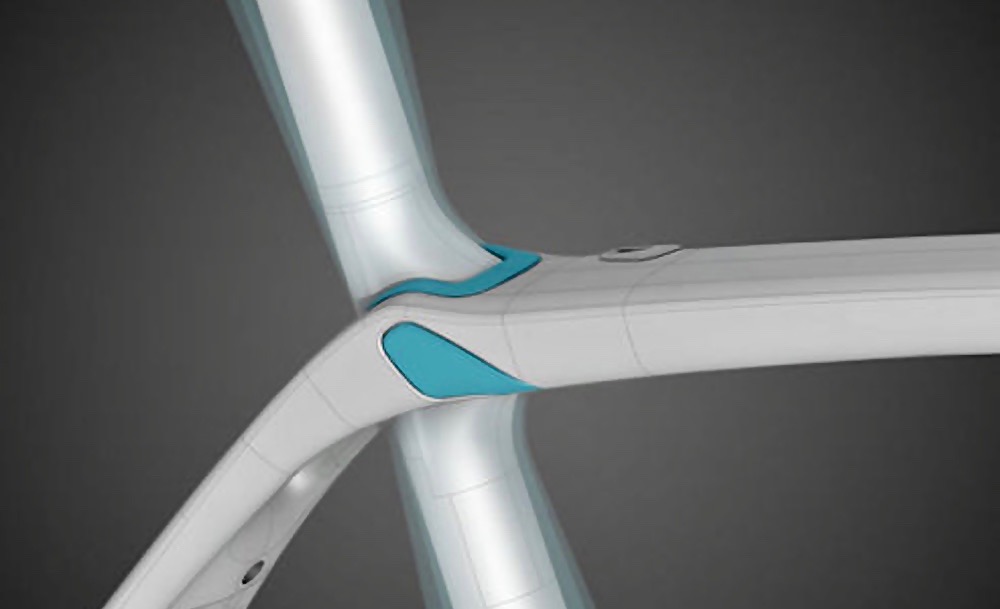
The latest Gen 5 Domane uses a conventional round seatpost and was tested with 35mm tyres. Despite using a simpler seatpost design, the Gen 5 is also 300 grams lighter because it no longer requires the Isospeed decoupler.
For the 25mm tyres, Trek used a tyre pressure recommendation based on its own historical data. For the 32mm and 35mm tyres, Trek established a baseline pressure using the Wolf Tooth Pressure Calculator, which considers factors including surface conditions, combined bike and rider weight, tyre size and tyre construction.
Road Bike Vibrational Power Results
| Tyre / Pressure | Vibrational Power | Vibration Transmitted | |
|---|---|---|---|
| Gen 4 Domane | 25mm / 93 psi | 12.1 W | Baseline |
| Gen 4 Domane | 32mm / 48 psi | 9.0 W | 25.6% Less |
| Gen 5 Domane | 35mm / 44 psi | 9.3 W | 23.1% Less |
When we look at the Gen 4 Domane results, the first thing that stands out is the effect of tyre size and pressure. Comparing the higher-pressure 25mm tyres with the lower-pressure 32mm tyres, vibrational power was reduced by almost 26% on Trek’s treadmill.
That’s a substantial improvement from a relatively simple change. So, if you’re looking to make a bicycle more comfortable, wider tyres and lower pressures are an obvious place to start.
Despite losing the Isospeed decoupler, the new Gen 5 Domane’s conventional round compliance seatpost produced a similar result to the Gen 4 when paired with its wider 35mm tyres. Vibrational power was within 6% of the Gen 4 with 32mm tyres. In practical terms, that difference would likely be difficult to notice.
It would have been interesting to see the Gen 4 Domane tested with 35mm tyres and the Gen 5 Domane with 32mm tyres. I suspect the gap between the two bikes would widen if they were tested with equivalent tyre sizes and pressures.
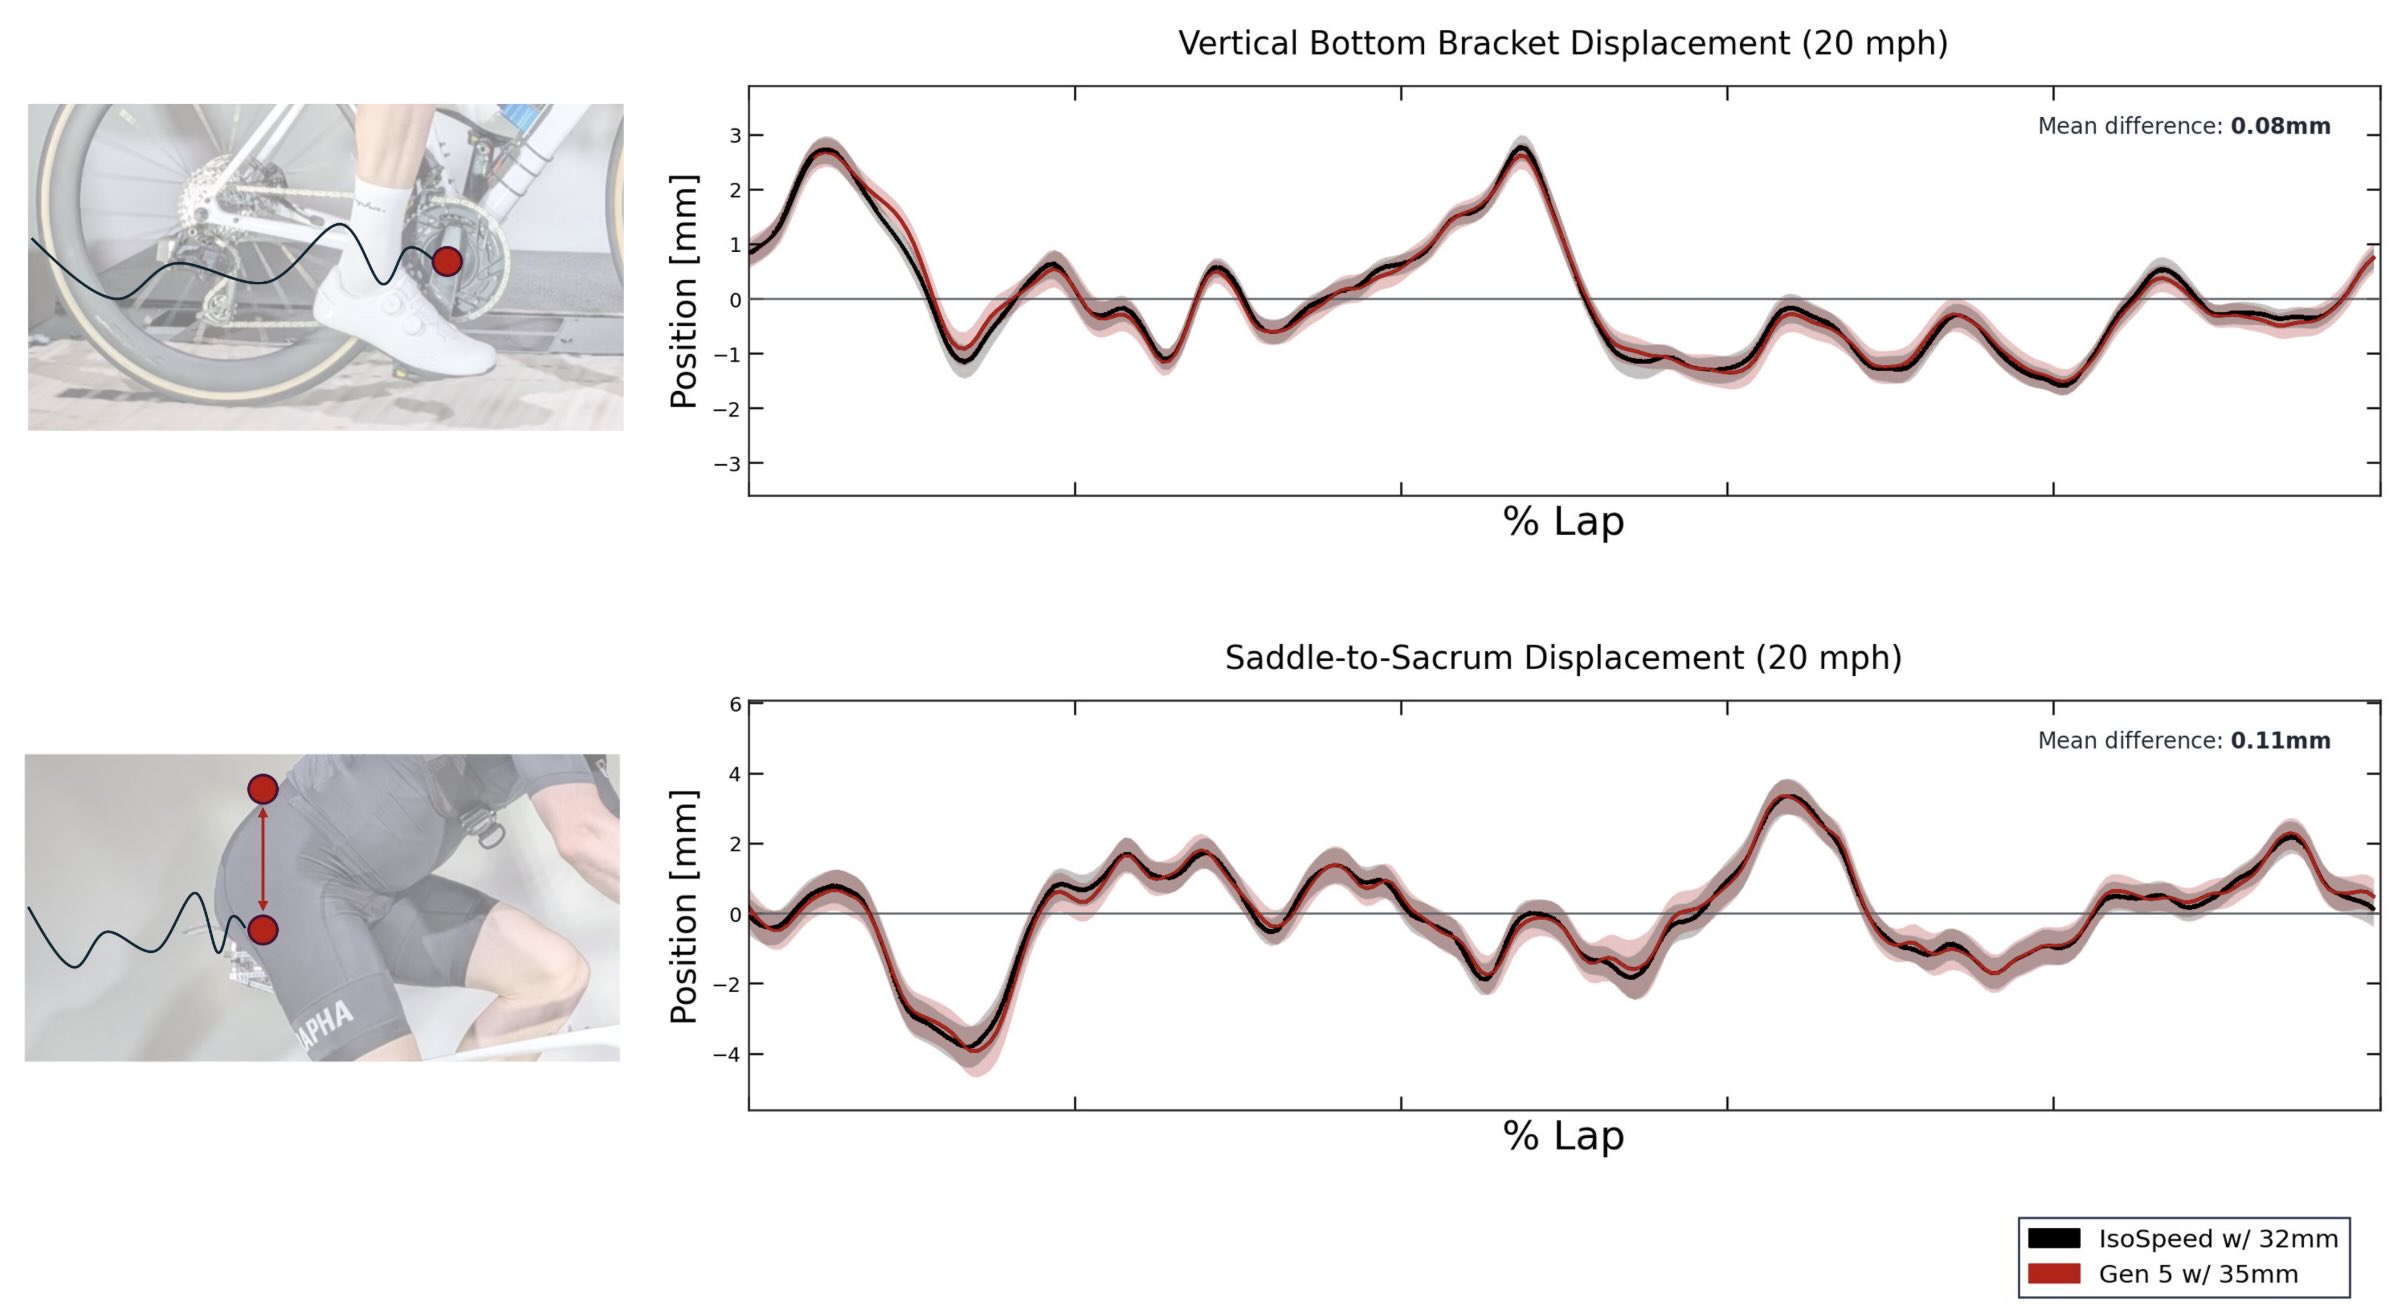
Trek also compared the two bikes using its saddle-to-sacrum coupling measurement.
According to Trek, the trends remained consistent across the tested speeds, but the engineers focussed on 32 km/h (20 mph) because this speed produced the greatest vertical displacement of the bike over the treadmill surface.
Between the Gen 4 with 32mm tyres and the Gen 5 with 35mm tyres, saddle-to-sacrum coupling differed by just 0.11mm, while vertical bottom-bracket displacement differed by only 0.08mm.
In other words, the two generations of Domane produced remarkably similar measurements for both rider and frame movement, despite the Gen 5 abandoning the Isospeed seatpost decoupler.
Rigid vs Full Suspension Gravel Bike Test
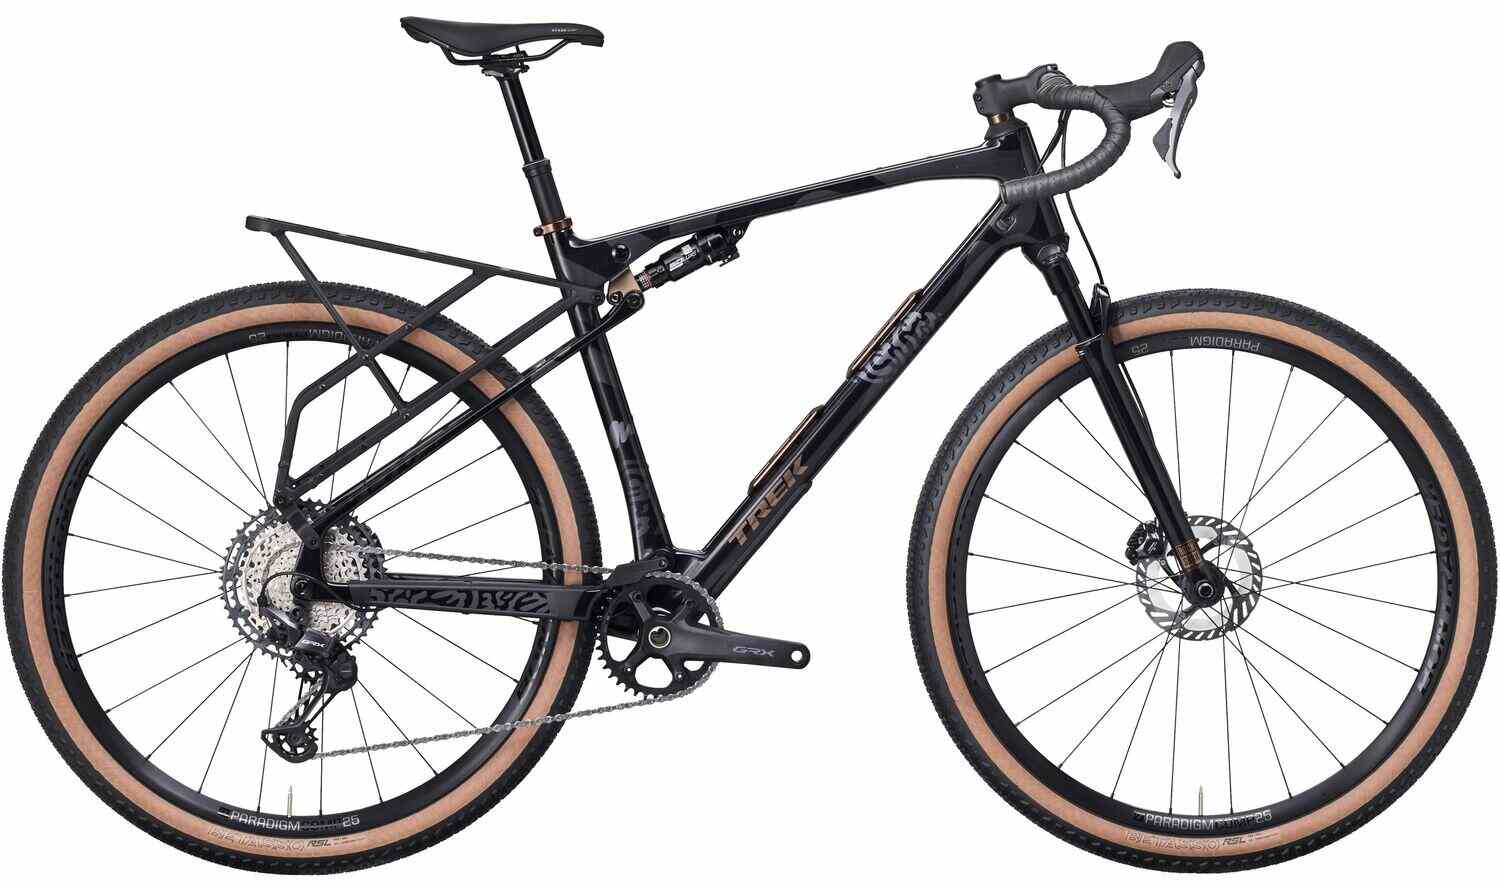
Things get even more interesting when we look at how Trek’s lab tested its full-suspension gravel bike against a conventional rigid gravel bike.
On the treadmill, Trek can measure the saddle’s rising and falling motion, as well as the forces generated as the rider weights and unweights the saddle. It can also measure the compression and rebound energy at the saddle.
Trek can then combine these measurements into a single vibrational comfort metric for each treadmill run called RMS power. Research from the University of Sherbrooke has shown that RMS power correlates strongly with dynamic comfort.
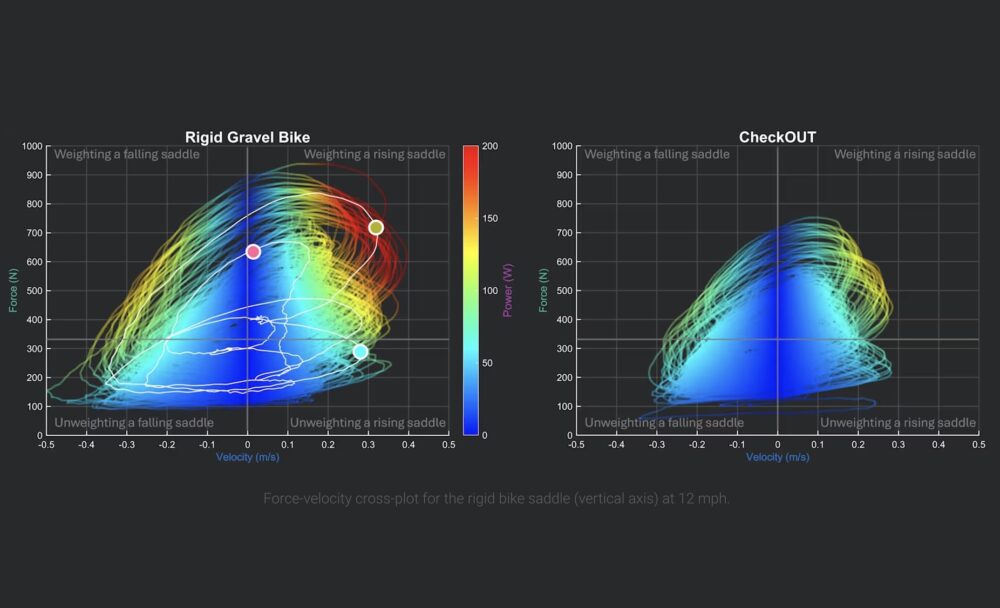
Trek can plot multiple measurements on a single graph, allowing its engineers to visualise both how the saddle moves and how much energy is involved in that movement for the rigid and full-suspension gravel bikes.
As you can see, the full-suspension gravel bike produces a noticeably more compact plot, with far fewer measurements falling into the high-power zones than the rigid gravel bike. This shows that the full-suspension bike produces lower forces at the saddle during rising, falling, weighting and unweighting events.
Comfort Across Different Frequencies
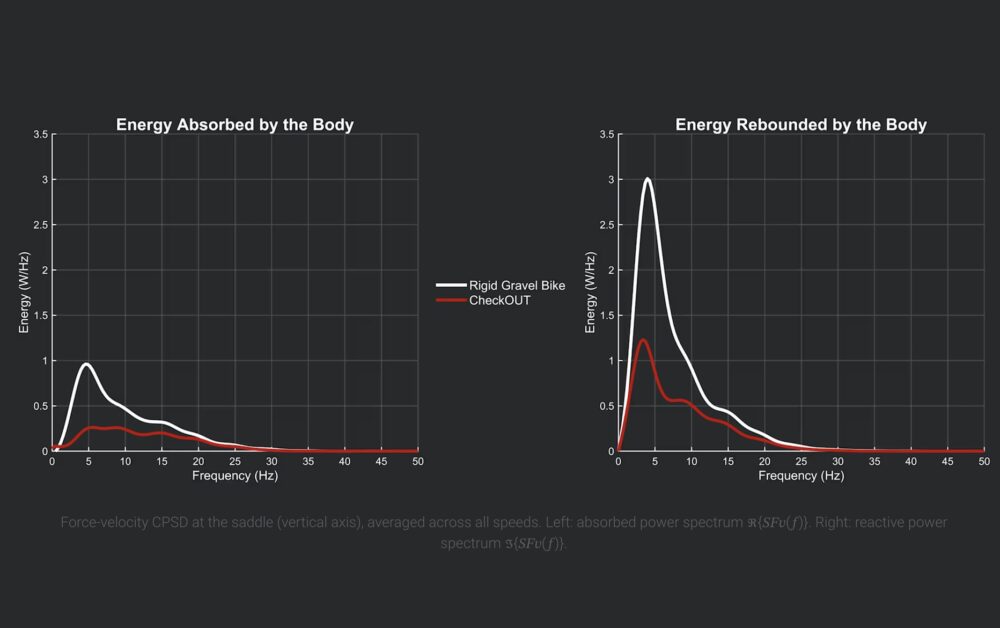
To better understand where vibrational energy goes, Trek can determine how that energy is distributed across different frequencies using cross-power spectral density analysis.
The frequency of a vibration can tell us a lot about the type of terrain producing it. Low-frequency vibrations below 10 Hz are more representative of slower impacts, such as riding over a log or large rock. High-frequency vibrations above 30 Hz, meanwhile, are more representative of riding quickly over the repetitive bumps of a gravel road.
Trek also separates the data into the energy absorbed by and rebounded from the rider’s body at the saddle. Absorbed energy (left graph above) is typically associated with energy loss, fatigue and tissue strain, while rebounded energy (right graph above) is more closely associated with bounciness and general saddle discomfort.
Interestingly, the differences between the rigid and full-suspension bikes were greatest at the lower frequencies in both graphs. This suggests that the biggest comfort advantage of full suspension occurs when dealing with slower, larger impacts below 10 Hz, rather than the fast, repetitive bumps encountered when riding quickly over gravel.
Our CYCLINGABOUT testing supports this finding, showing that suspension can be much less effective at higher frequencies on fast gravel roads. In fact, we measured virtually zero difference between a Lefty gravel suspension fork when locked and unlocked at 35 km/h on a fast gravel road.
Vibrational Energy Test
| Speed | Rigid Bike 50mm Tyres (Vibrational Energy) | Full Sus 50mm Tyres (Vibrational Energy) | Full Sus 55mm Tyres (Vibrational Energy) |
|---|---|---|---|
| 6 mph / 9.7 kph | Baseline | 54% Less | 65% Less |
| 9 mph / 14.5 kph | Baseline | 52% Less | 56% Less |
| 12 mph / 19.3 kph | Baseline | 43% Less | 54% Less |
| 15 mph / 24.1 kph | Baseline | 34% Less | 44% Less |
| 18 mph / 29.0 kph | Baseline | 32% Less | 40% Less |
| Average | Baseline | 41.5% Less | 48.7% Less |
When Trek compared its full-suspension gravel bike with the rigid gravel bike on the treadmill, the difference in vibrational energy was significant.
The advantage was greatest at lower speeds, where the full-suspension bike produced up to 65% less vibrational energy at the saddle. At the highest tested speed, the reduction was smaller, but still substantial at 32%.
It turns out suspension really is comfortable… shocking, I know!
Interestingly, increasing tyre width by another 5mm had a relatively small effect on vibrational energy. Within the range of tyre widths Trek tested, this suggests that the suspension system was responsible for much of the comfort improvement, rather than the additional tyre volume.
Saddle to Sacrum Test
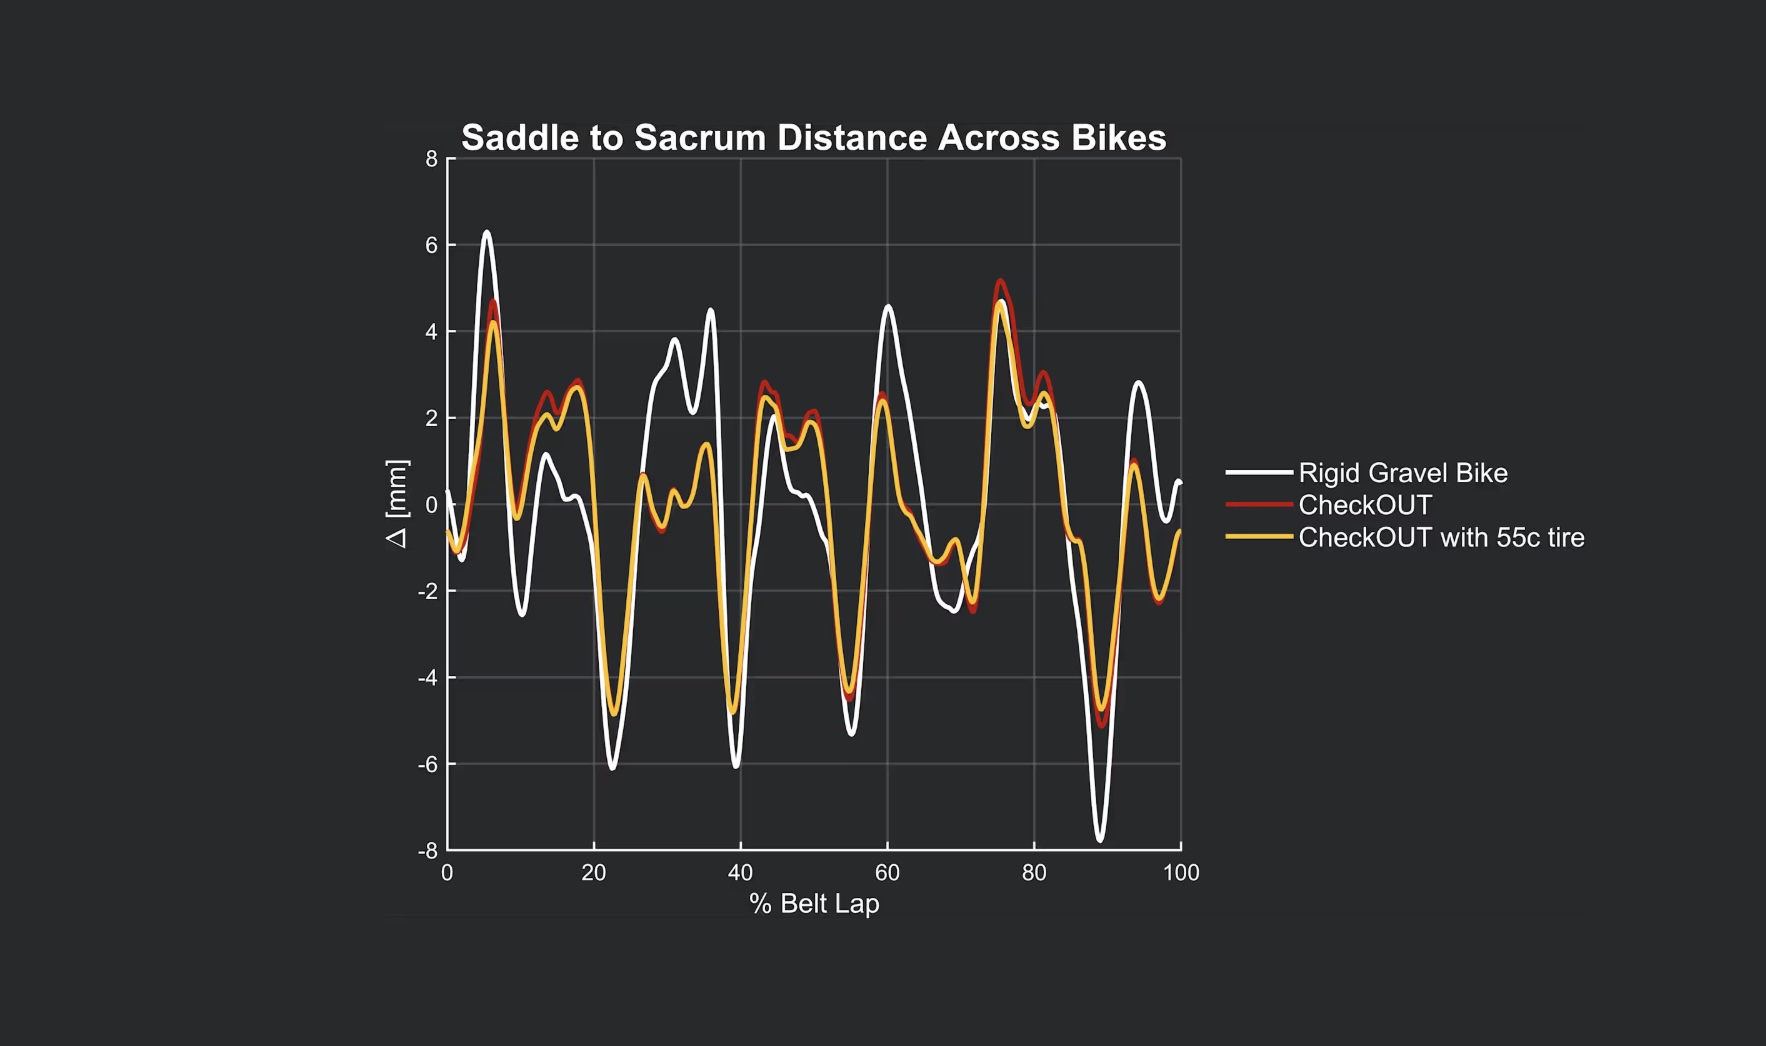
When it came to the saddle-to-sacrum coupling test, the differences between the rigid and full-suspension bikes were even more pronounced.
Averaged across all tested speeds, the full-suspension bike showed a 27% reduction in saddle-to-sacrum separation with 50 mm tyres, and a 32% reduction with 55 mm tyres.
In other words, the rider on the full-suspension bike remained more closely coupled to the saddle, staying seated more consistently than the rider on the rigid bike while riding over the same surface.
Summary
Trek’s Performance Research Lab takes a scientific approach to understanding bicycle comfort, using sophisticated sensors and motion-capture tech to measure what happens to both the bike and rider over controlled surfaces.
The testing reveals how factors such as tyre size, tyre pressure and suspension elements influence vibrational energy and rider movement.
Together, these measurements provide a much more detailed picture of comfort than subjective impressions alone, ultimately providing some very useful insight into why some bikes and components feel more comfortable than others.


