
A bicycle chain articulates roughly 40,000 times per minute as it weaves through the derailleur and around the sprockets. Each of these tiny link movements generates friction – energy lost that would otherwise propel you forward.
A well-maintained derailleur drivetrain typically operates at over 97% efficiency, meaning about 97% of your pedalling power reaches the rear wheel, while the remaining 3% is consumed by frictional losses.
This efficiency depends on a wide range of factors: the lubricant type, drivetrain quality, component wear, sprocket sizes, chainline angle, chainring and link geometry, the rear derailleur’s clutch mechanism, jockey wheel size, as well as the rider’s power output and cadence, and more. The interplay of these variables explains why 1X and 2X drivetrains exhibit measurable differences in frictional losses.
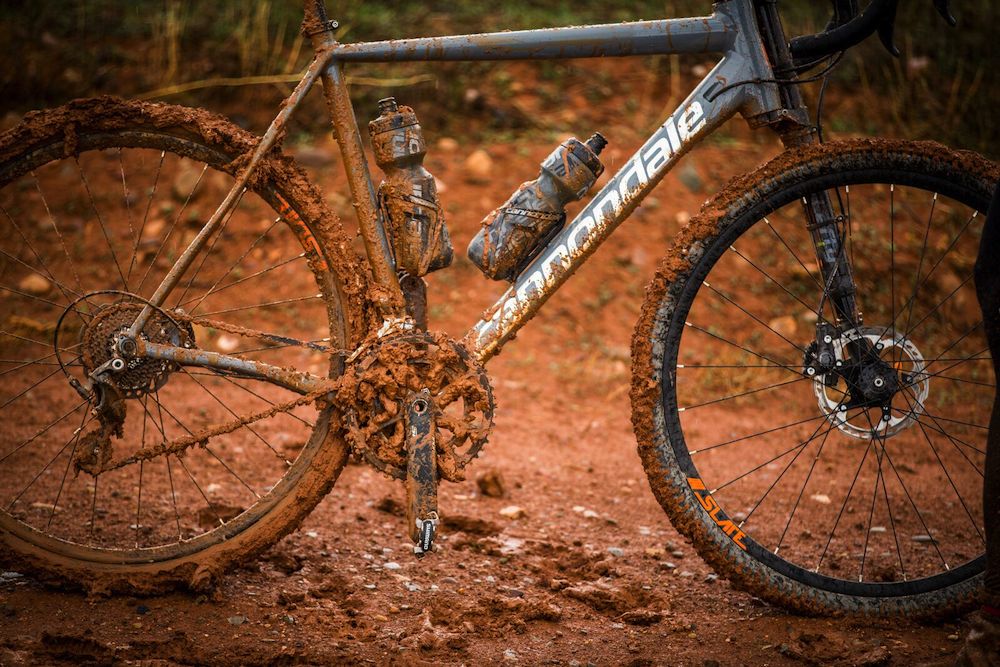
Chain cleanliness is another major factor. The type and quantity of grit, along with how much lubricant remains, can significantly alter drivetrain efficiency.
Given all these variables, it’s nearly impossible to quantify exactly how much a dirty chain slows you down – but the data below should offer a solid approximation.
How Drivetrain Efficiency Is Measured
The drivetrain efficiency data discussed here originates from Friction Facts, an independent test laboratory that conducted these experiments roughly a decade ago. I’ve previously analysed their findings in my articles comparing belt drivetrains and 1X vs. 2X drivetrains.
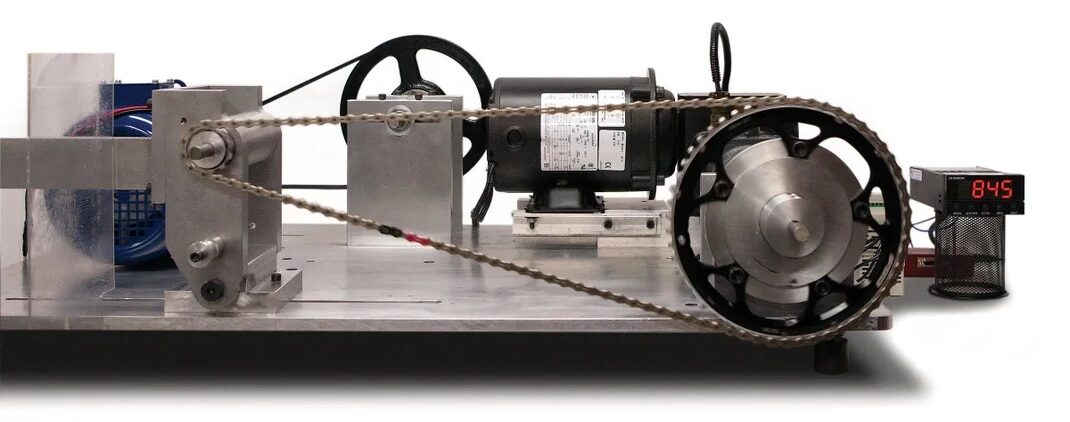
All tests were performed using a custom-built test rig designed to replicate real-world riding conditions. Chain tension was set to simulate a 250-watt power output at a cadence of 90 RPM. Each chain underwent a five-minute run, with efficiency data recorded at the end of that period. To ensure consistency, every chain was installed in the same orientation each time it was mounted or removed.
The test rig itself is highly precise, accurate to within ±0.02 watts, and the minor energy losses from its four ceramic bearings were subtracted from the final results to isolate drivetrain performance.
Dirty Bicycle Chain Efficiency Test #1
| Efficiency | Decrease in Efficiency vs Clean and Lubed | |
|---|---|---|
| Clean and Lubed Chain | 97.6% | – |
| Wet Chain | 94.8% | -2.8% |
| Muddy and Wet Chain | 94.4% | -3.2% |
| Muddy and Dry Chain | 92.8% | -4.8% |
In this first experiment, a clean chain lubricated with a light oil-based lubricant achieved a drive efficiency of 97.6%.
After exposure to rain*, efficiency dropped by 2.8%, and with wet mud contamination, it declined by 3.2%. Once the mud had dried, efficiency fell further to 92.8% – meaning nearly 5% more of your pedalling power was being lost to drivetrain friction.
*Unfortunately, the test documentation did not specify the exact duration or environmental conditions of the “rain” test period.
Dirty Bicycle Chain Efficiency Test #2
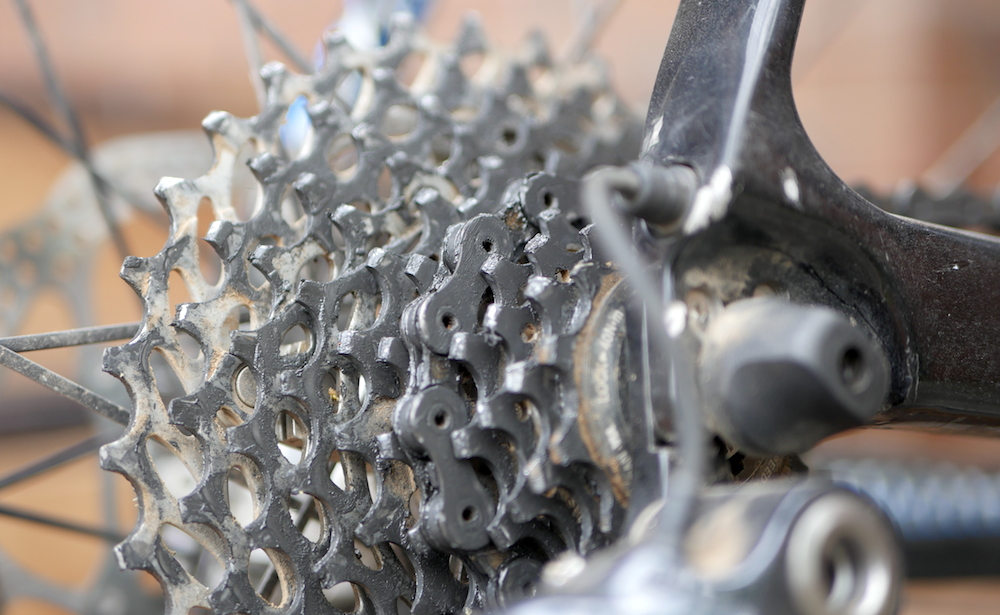
In a second experiment, Friction Facts tested drivetrain efficiency under real-world race conditions. Six participants took part in a cyclocross race in Boulder, USA, with their chains measured for efficiency both before and after the one-hour event to assess the impact of grit and contamination.
Three riders used CeramicSpeed UFO V1–treated chains, which feature an immersion wax coating that hardens onto the chain to provide lubrication. The remaining three used light oil-lubricated chains, representing a more typical setup.
| Efficiency While Clean | Efficiency Post Race | Decrease In Efficiency | |
|---|---|---|---|
| Waxed Chain #1 | 97.6% | 96.8% | -0.8% |
| Waxed Chain #2 | 97.2% | 96.8% | -0.4% |
| Waxed Chain #3 | 97.2% | 96.4% | -0.8% |
| Efficiency While Clean | Efficiency Post Race | Decrease In Efficiency | |
|---|---|---|---|
| Oiled Chain #1 | 98.0% | 96.0% | -2.0% |
| Oiled Chain #2 | 97.4% | 96.8% | -0.6% |
| Oiled Chain #3 | 97.2% | 94.8% | -2.4% |
Following the race, results showed that the wax-treated chains experienced an average efficiency loss of just 0.7%, while the oil-treated chains lost about 1.7%. The difference is likely due to the wax coating’s ability to repel grit and act as a physical barrier, preventing contaminants from working their way into the chain’s moving parts.
The Efficiency of an Unlubricated Drivetrain
The sound of a noisy chain is often your first clue that friction levels are rising. Since each chain link involves metal-on-metal contact, lubrication is essential to keep things running smoothly and efficiently.
So what actually happens when there’s no lubricant left on your chain?
| Efficiency When Clean and Lubed | Efficiency When Stripped | Decrease in Efficiency | |
|---|---|---|---|
| Chain #1 | 97.6% | 92.0% | -5.6% |
| Chain #2 | 97.2% | 92.0% | -5.2% |
| Chain #3 | 97.2% | 92.0% | -5.2% |
| Chain #4 | 97.6% | 89.6% | -8.0% |
| Chain #5 | 97.2% | 90.4% | -6.8% |
| Chain #6 | 97.2% | 92.0% | -5.2% |
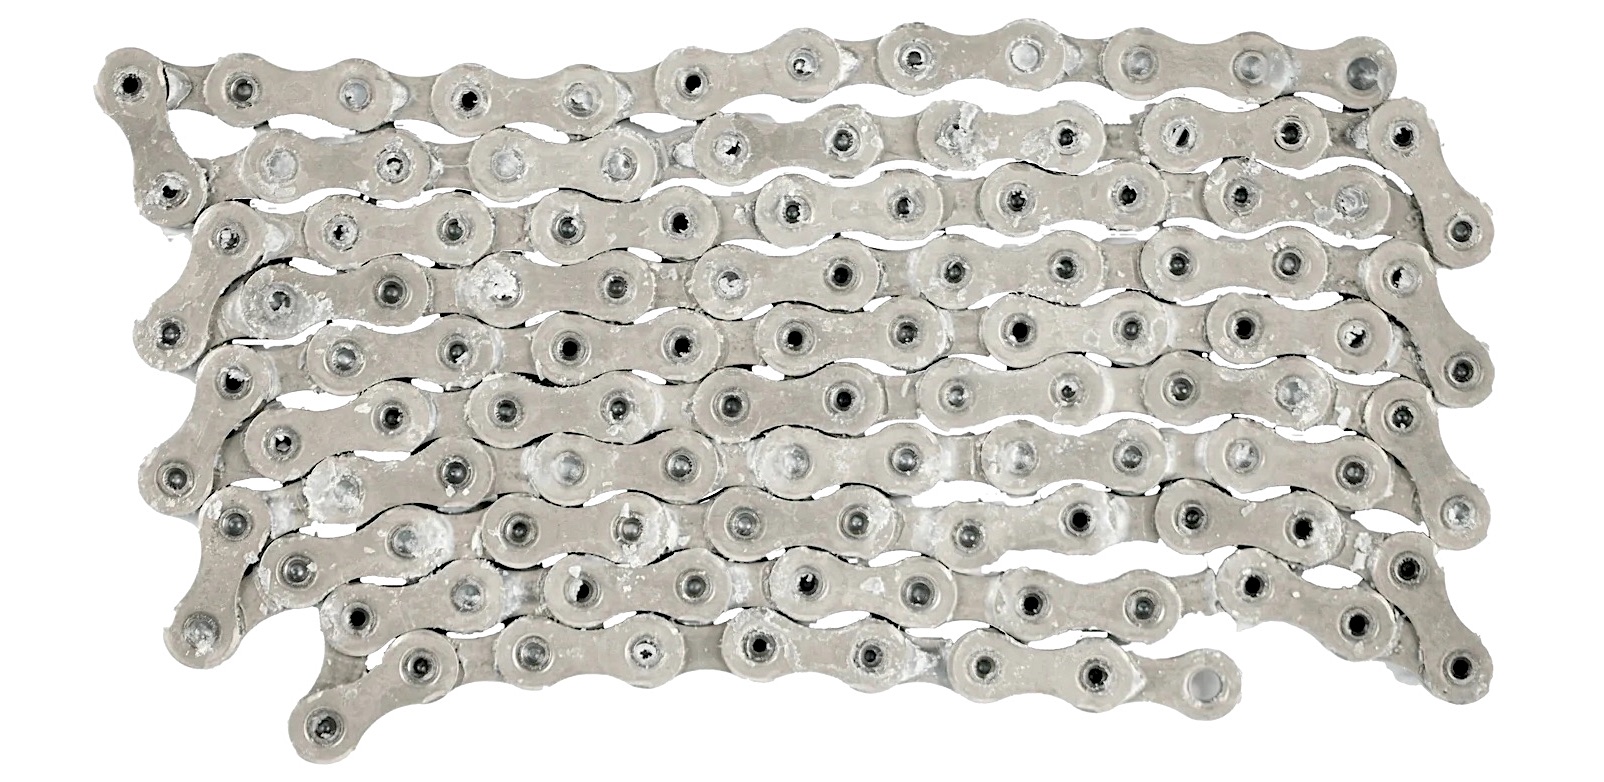
In this test, six chains were thoroughly cleaned and lubricated with a light oil-based lube. When placed on the test rig, each achieved over 97% drive efficiency.
The same six chains were then completely degreased using an ultrasonic cleaner, removing every trace of lubrication. When retested, their efficiencies dropped to between 89.6% and 92.0%.
On average, this means that around 6% of your pedalling power is lost when riding with a completely dry chain. Even a muddy chain with a hint of lubricant performs better than one that’s entirely unlubricated.
So, the next time your chain starts to squeak, take it as a clear signal – your drivetrain is begging for some lube.
How Much Does A Dirty Chain Slow You Down?
Using Bike Calculator, we can simulate how chain contamination affects riding speed by comparing a perfectly clean, well-lubricated chain with chains of varying “dirtiness.” The friction inputs are based on Friction Facts’ first test and the averaged data from the unlubricated-chain experiment.
Let’s assume our rider, bike, and gear together weigh 85 kg (187 lb), and the rider is on a gravel bike with their hands on the brake hoods.
Simulated Average Speed On Flat Gravel Terrain (250W)
Clean and Lubed – 31.38km/h
Rainy and Lubed – 30.99km/h – 1.2% Slower
Wet, Muddy and Lubed – 30.94km/h – 1.4% Slower
Dry, Muddy and Lubed – 30.71km/h – 2.1% Slower
No Lubricant – 30.53km/h – 2.7% Slower
Interestingly, the differences in cycling speed are not as dramatic as many might expect. This is because aerodynamic drag and tyre rolling resistance are typically the two dominant forces acting against a cyclist, while drivetrain losses are relatively minor in comparison.
Depending on the chain’s level of contamination, the reduction in cycling speed is between 1.2% and 2.1%, while using a completely unlubricated chain slows the bike by nearly 3%.
However, because the Friction Facts test was conducted at a relatively high 250-watt power output, I also ran a simulation at a more realistic 150 watts to better reflect the performance of an average cyclist.
Simulated Average Speed On Flat Gravel Terrain (150W)
Clean and Lubed – 24.75km/h
Rainy and Lubed – 24.36km/h – 1.6% Slower
Wet, Muddy, and Lubed – 24.30km/h – 1.8% Slower
Dry, Muddy, and Lubed – 24.07km/h – 2.7% Slower
No Lube or Contamination – 23.88km/h – 3.5% Slower
Drivetrain friction decreases roughly linearly with power, according to data from recent belt drive efficiency tests. Applying this trend suggests a 31% reduction in frictional losses when power drops from 250 to 150 watts. With this lower output, wind resistance also becomes less dominant, which slightly increases the relative effect of drivetrain friction.
Under these conditions, we see a speed reduction of around 1.6% to 2.7%, depending on how dirty the chain is, and up to 3.5% slower if the chain has no lubrication at all.
Summary
The data shows that a dirty bicycle chain operates at around 92.8% to 96.8% efficiency, depending on the level of contamination. This translates to a 1 to 3% reduction in cycling speed.
While these differences are smaller than the performance impact of aerodynamic luggage setups or tyre rolling resistance, maintaining a clean and lubricated chain is simple and worthwhile. A smooth-running drivetrain not only helps you ride faster, but also keeps your bike quieter and reduces wear on components – ultimately saving you money in the long run.


