Read More 10 minute read The 5 Best Bicycle Touring Tires For Puncture Resistance, Durability & Speed The best bicycle touring tires are puncture-resistant, fast rolling and durable, which is perfect for long-distance travel. byAlee DenhamDecember 17, 2025
Read More 8 minute read Drivetrain Efficiency: What’s The Difference In Speed Between 1X and 2X? This article explores drivetrain efficiency differences between 1X and 2X systems, focusing on frictional losses, chain angles, and performance. byAlee DenhamOctober 5, 2025
Read More 13 minute read Dynamo Hub Power and Drag Testing: SON vs Shutter Precision vs Shimano This latest round of testing pairs four popular dynamo hubs with a variety of dynamo lights and USB chargers, with power and drag measurements taken from 0 to 30 km/h. byAlee DenhamJune 16, 2025
Read More 9 minute read I Went On A Quest To Find The Most Comfortable Bar Tape I think I found it. byKrzysztof WierzbickiMay 21, 2025
Read More 9 minute read The Best Gravel Handlebars Compared For Comfort: Deda Gera vs Lauf Smoothie If you're after the best gravel handlebars with a high degree of comfort, you've come to the right place. byKrzysztof WierzbickiOctober 29, 2024
Read More 5 minute read How Much Does A Dirty Bicycle Chain Slow You Down? (Drive Efficiency Test) Unsurprisingly, your drive efficiency reduces significantly when you have a dirty chain. byAlee DenhamOctober 30, 2023
Read More 4 minute read Why My Approach To Testing Bike Vibrations Has Changed Over Time My latest approach to vibration testing yields results that are repeatable, no matter the weather conditions. byKrzysztof WierzbickiJune 28, 2023
Read More 2 minute read How We Test Bike Comfort Using Controlled Obstacles Using a new vibration measurement procedure, my test results are repeatable, comparable, and at slower cycling speeds. byKrzysztof WierzbickiJune 27, 2023
Read More 4 minute read Redshift ShockStop Endurance Suspension Seatpost Review: Insane Comfort! If you are after the best possible suspension seatpost - this is it! byKrzysztof WierzbickiJune 25, 2023
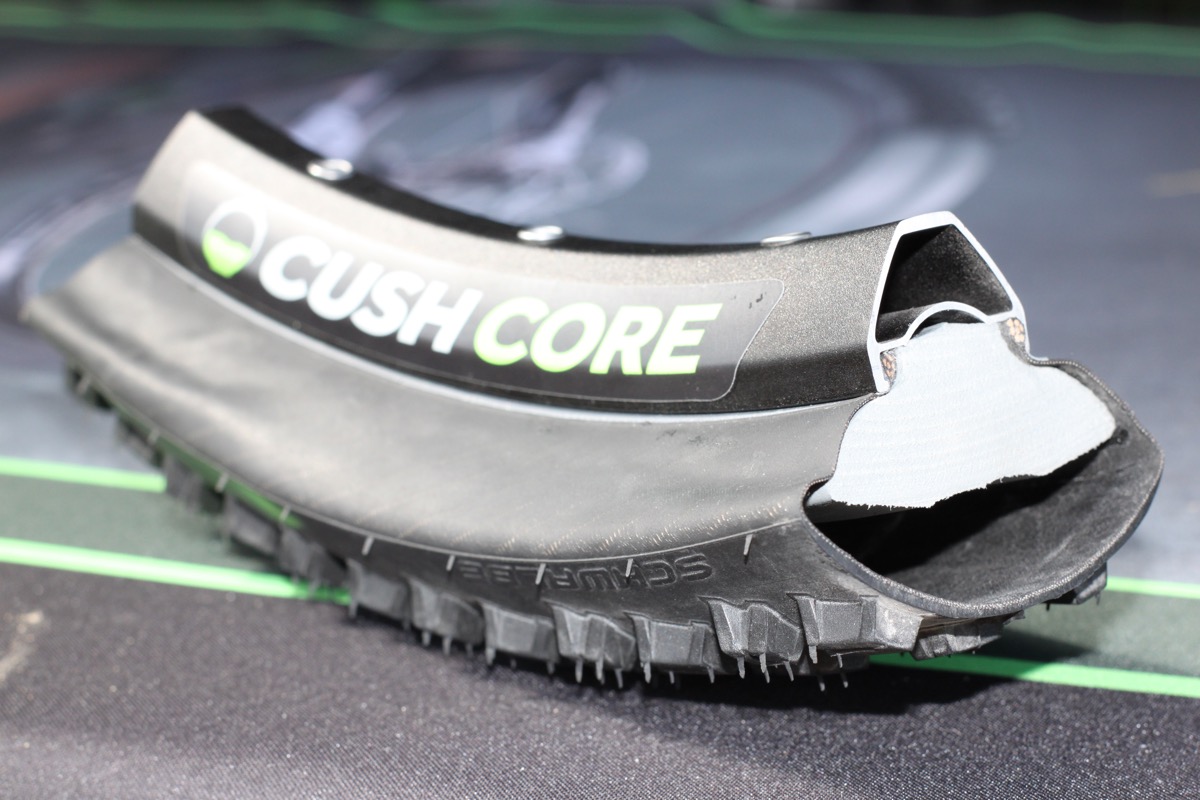
Read More 4 minute read Cushcore Tire Inserts Review: A Shocking Result On Gravel Roads Cushcore tire inserts are almost too good to be true. byKrzysztof WierzbickiJune 24, 2023