

Aero bikes have improved in leaps and bounds in recent years. Once criticised for their unforgiving ride and narrow focus, some models are now offering more seatpost compliance and far greater tyre clearance, making them surprisingly comfortable to ride.
But still, many of the fastest aero bikes in the world are stuck with deeply ovalised seatposts that take a lot of force to flex vertically. So I wondered, are these aerodynamic seatpost shapes actually reducing an aero bike’s speed and efficiency?
Road.cc brought an aero bike with an ovalised seatpost and a lightweight road bike with a round seatpost to Silverstone Sports Engineering (SSE) to find out. There, engineers measured the rider’s input power at the pedals and compared it to the power delivered to the rollers, yielding a precise efficiency figure for the complete bike-and-rider system.
Before we look at the lab results, it helps to understand why more system compliance can actually make a bike faster.
Why More System Compliance Can Be Faster
Most riders now accept that the fastest road bike tyres aren’t pumped to the absolute maximum pressure.
If a tyre is too firm, it can’t conform to the road, sending vibrational energy through the bike and rider rather than using it to propel it forward. And if a tyre is too soft, energy is lost through excessive sidewall deformation.
Ultimately, tyres need a degree of controlled flex to maintain the fastest cycling speeds. That’s why there’s a clear pressure sweet spot: enough compliance to damp vibration and maintain stable ground contact, and enough air to control sidewall casing losses.
In a lab test by GCN Tech, Ollie found his road bike tyre pressure sweet spot to be 72 psi. When he dropped his pressure to 58 psi, it increased his rolling resistance by 2 watts. And when he increased it to 87 psi, his rolling resistance also increased by 3 watts.
If we zoom out a bit, the same compliance principle applies to the rest of the bike. While the tyre is the first in line for absorbing surface irregularities, if it cannot absorb all of the small vertical impacts before they hit your body, the job is passed onto the seatpost.
And we’ve actually seen this in suspension seatpost tests. A recent lab test comparing suspension vs rigid seatposts found that the more compliant suspension post saved as much as 13 to 14 watts of power over a rigid seatpost on rough surfaces (seriously!).
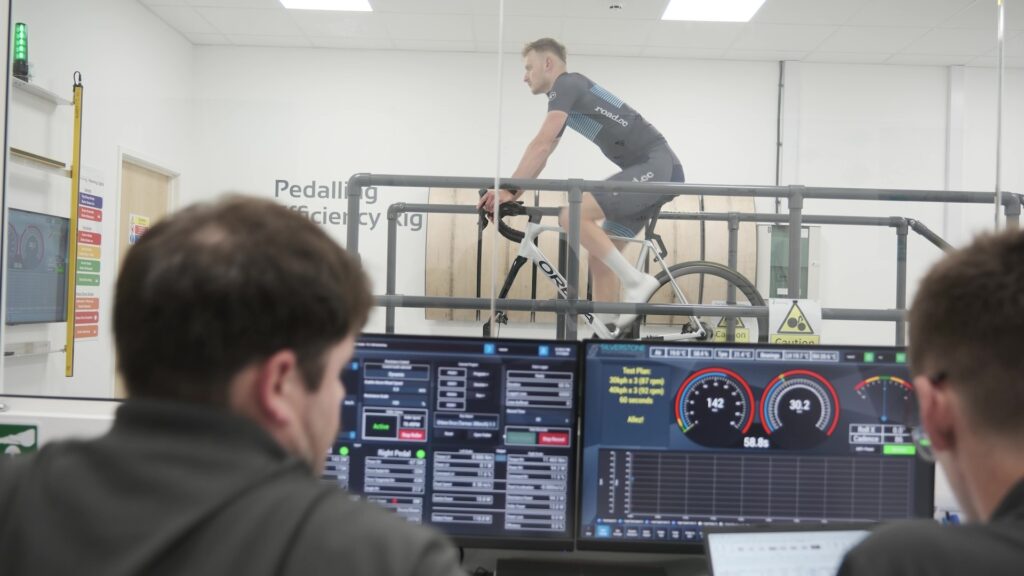
How the Pedalling Efficiency Rig Measures Bike Performance
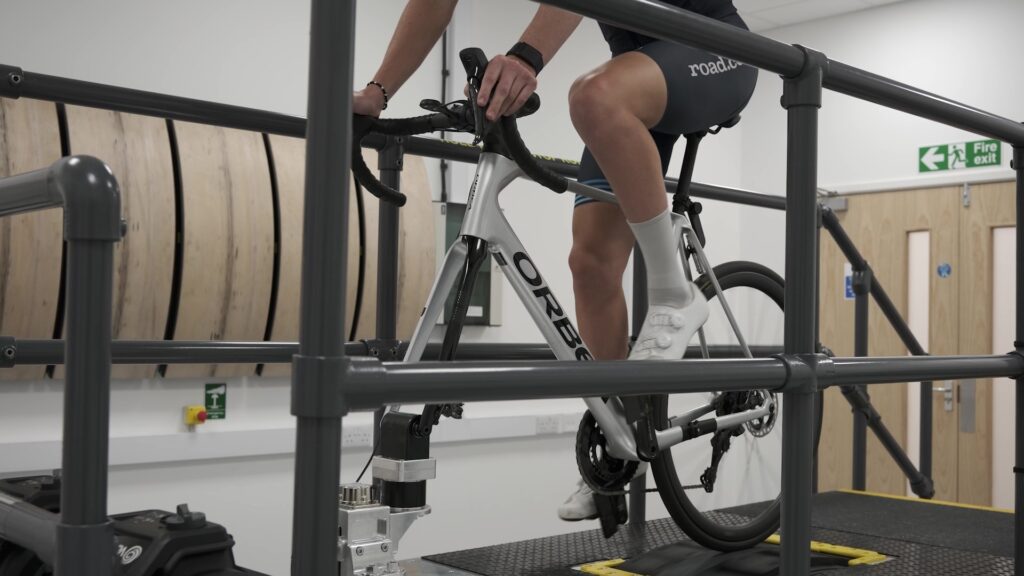
The Pedalling Efficiency Rig is a bicycle dynamometer that measures the rider’s input power at the pedals and compares it to the output power delivered to a two-metre roller. By analysing the difference, the system calculates total mechanical losses and overall drivetrain efficiency in a tightly controlled environment.
This setup is especially useful for isolating variables such as tyre pressure, tyre and wheel choice, bearings, drivetrain configuration, chain lubrication, and frame and seatpost compliance – all of which can influence how much of your effort actually makes it to the road.
The fork is secured to a solid block, allowing the bike to pivot and roll while remaining fixed in position. Although this doesn’t perfectly replicate real-world terrain dynamics, anchoring the bike significantly improves test repeatability and consistency.
There’s no real aerodynamic drag acting on the rider in this indoor setup. Instead, aerodynamic resistance is simulated using electromagnetic resistance applied to the roller. This resistance is precisely calibrated according to wheel speed and the drag-velocity profile of a rider with a given CdA.
You can see the full lab test HERE.
Lightweight vs Aero Bike Lab Test
For this lab test, Road.cc got their hands on an aero and a lightweight road bike that were built with identical components – same wheels, tyres, tyre pressures, and drivetrain. Ultimately, the frame and seatpost were the only variables.
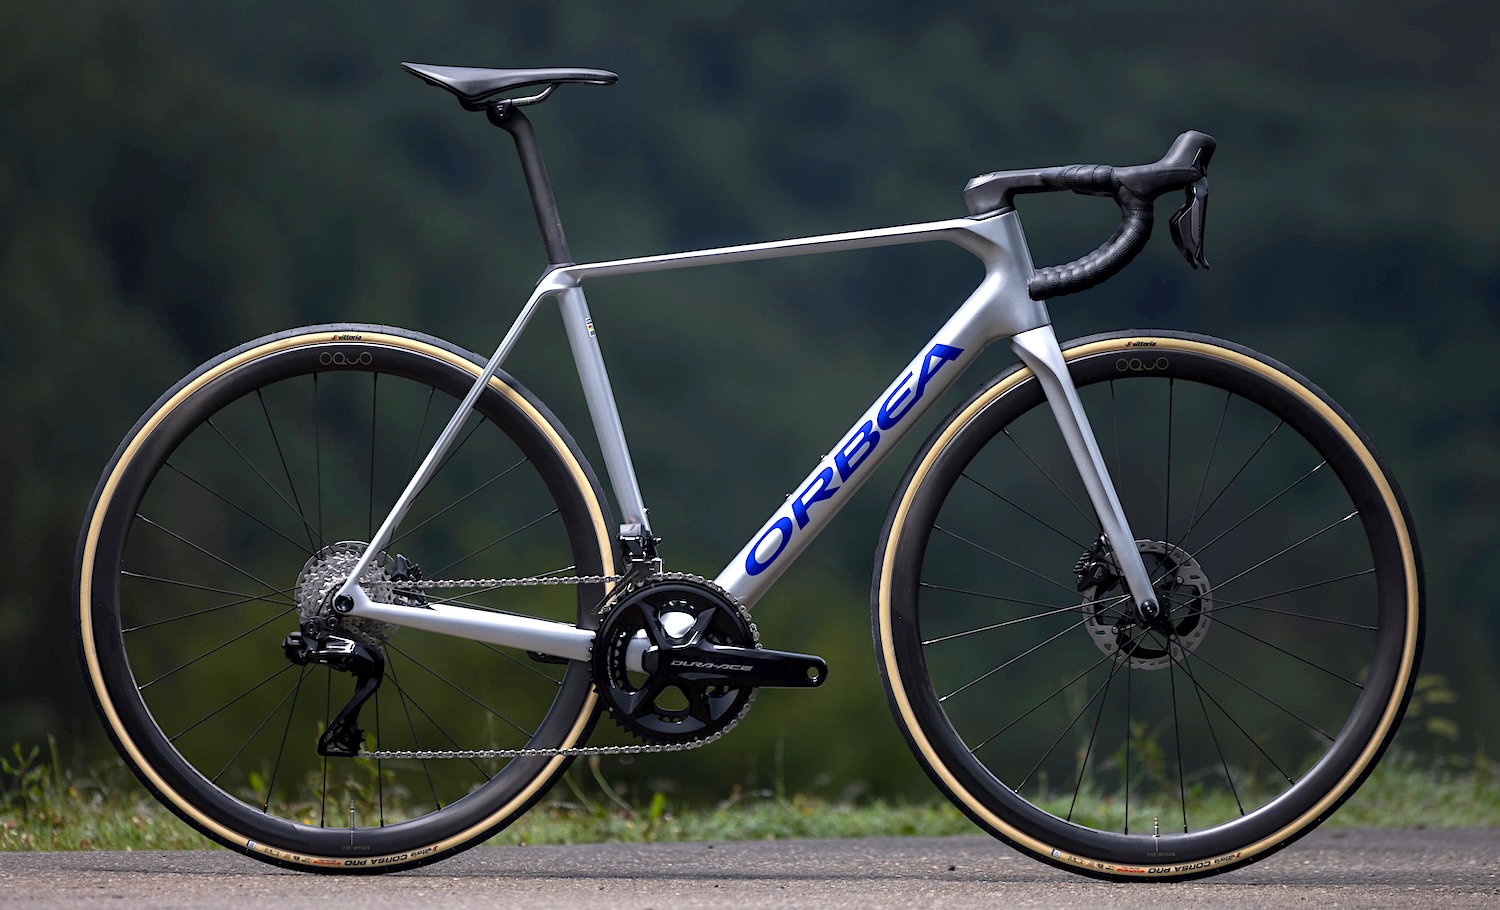
The lightweight bike was a 2024 Orbea Orca M10i LTD, equipped with Oquo Road Performance RP35LTD wheels, Pirelli P Zero Race TLR 28mm tyres, and a full Shimano Dura-Ace Di2 R9200 drivetrain. Total weight came in at 7.04 kg.
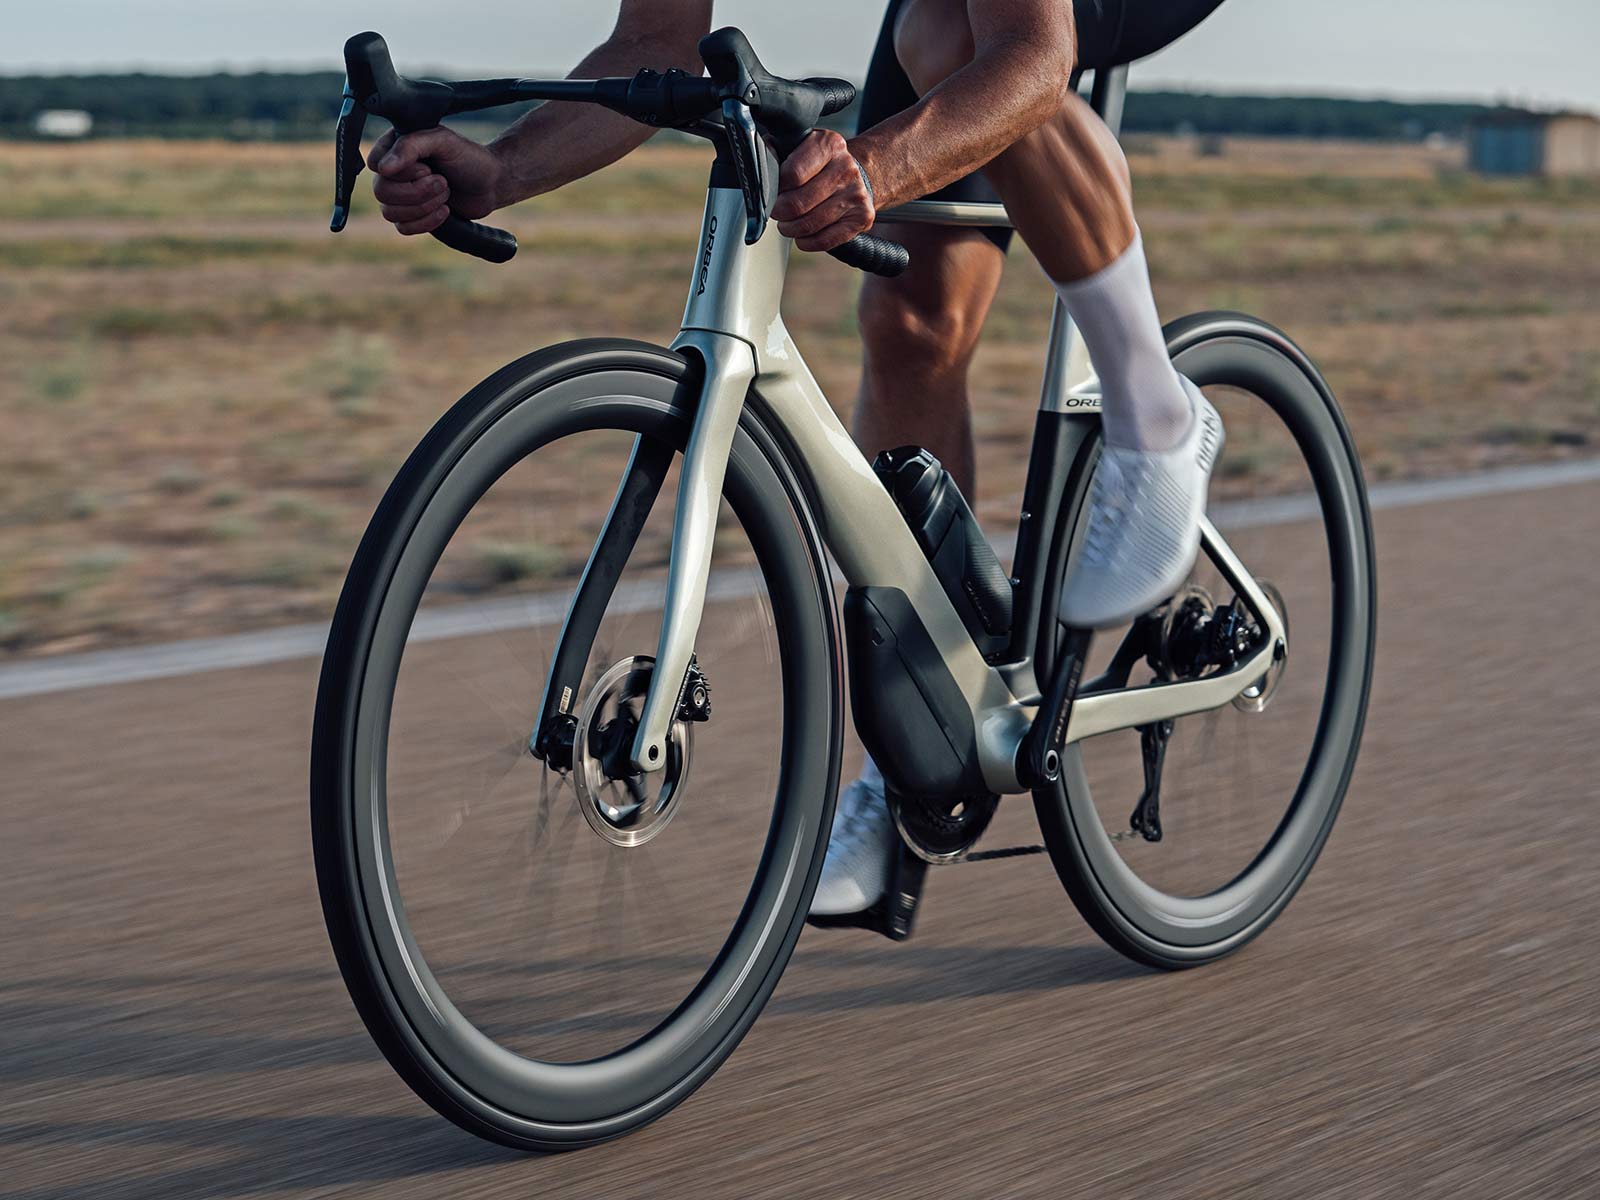
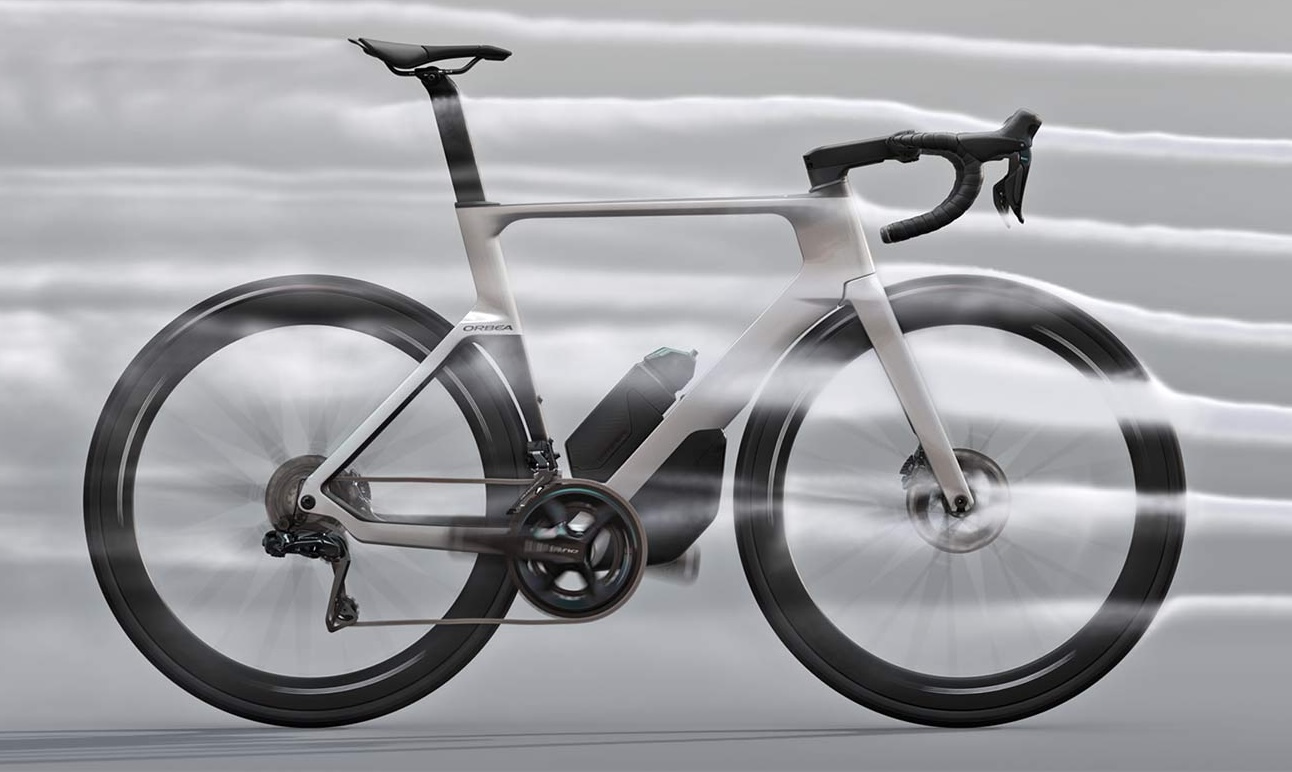
The aero bike was a 2024 Orbea Orca Aero M10i LTD, running the same wheels, tyres, and drivetrain. It weighed 7.81 kg – a total of 774 grams heavier overall.
Simulated Road Surfaces and Rider Consistency

Two simulated road surfaces were used: one representing a smooth road, and the other mimicking rough stone paving blocks (left side in the image above). Each bike was tested at 30km/h and 40km/h.
Power input was controlled for every speed and surface condition, ranging from around 130 watts to more than 300 watts. The same 183cm, 73kg rider was used throughout, maintaining an identical position on both bikes.
Ultimately, this represents as tightly controlled a mechanical comparison as possible, and crucially, the results were highly repeatable for both bikes.
Data Disclaimer: Please note that Road.cc’s original data presentation contained issues: the graphs were incorrectly labelled, and it was difficult to determine the exact efficiency and drag values from their graphs. As a result, many of the numbers presented here are estimates. That said, the key results stated explicitly in the article (namely, the efficiency and power differences between the bikes) are confirmed and accurate.
Bike Efficiency Lab Test Results
Simulated Smooth Road at 30 km/h
| Lightweight Bike | Aero Bike | Lightweight Bike Advantage | |
|---|---|---|---|
| Watts Lost | 21W | 24W | 3 Watts Less |
| Overall Efficiency | 84% | 82% | 2% More Efficient |
The first test was conducted on the simulated smooth road, where 21 to 24 watts were lost between the rider and the roller. In this scenario, the lightweight bike had a 3-watt advantage over the aero bike.
Assuming the rider was pedalling at 132 watts for both bikes, this translates to the lightweight bike being roughly 2% more efficient than the aero bike.
Simulated Smooth Road at 40 km/h
| Lightweight Bike | Aero Bike | Lightweight Bike Advantage | |
|---|---|---|---|
| Watts Lost | 31.5W | 34.5W | 3 Watts Less |
| Overall Efficiency | 90% | 89% | 1% More Efficient |
When the speed increased to 40 km/h, total resistance rose by about 10 watts overall. However, the power difference between the two bikes remained at 3 watts, meaning the efficiency gap narrowed to just 1%.
In general, efficiency increases with speed because the same absolute losses represent a smaller fraction of total power. Consequently, overall efficiency climbed to around 90%, up from 82 to 84% at lower speeds.
But what happens if we use a rougher surface texture on the Pedalling Efficiency Rig?
Simulated Rough Road at 30 km/h
| Lightweight Bike | Aero Bike | Lightweight Bike Advantage | |
|---|---|---|---|
| Watts Lost | 30W | 33W | 3 Watts Less |
| Overall Efficiency | 79% | 77% | 2% More Efficient |
When the lab tested the bikes on a drum simulating a rougher surface, efficiency for both bikes dropped by roughly 5% compared to the smooth surface. This drop is primarily due to tyre deformation losses, which dominate on rougher surfaces.
The difference between the lightweight and aero bikes remained at around 3 watts, with the lightweight bike again about 2% more efficient.
Simulated Rough Road at 40 km/h
| Lightweight Bike | Aero Bike | Lightweight Bike Advantage | |
|---|---|---|---|
| Watts Lost | 40W | 43W | 3 Watts Less |
| Overall Efficiency | 86% | 87% | 1% More Efficient |
And lastly, increasing the speed on the bumpy surface to 40 km/h raised total power losses to roughly 40 watts, but the gap between the two bikes stayed near 3 watts.
At higher speeds, overall efficiency climbed again to around 86 to 87%, with the lightweight bike now about 1% more efficient on the simulated rough road.
Where’s the 3 Watts of Energy Going?
In every test, the road bike with the round seatpost consistently transferred roughly 3 watts more of the rider’s power to the roller compared with the bike with the oval seatpost. So, where could those 3 watts be getting lost?
While we can’t be definitive, the most plausible explanation is differences in overall system compliance.
The data suggest that the lightweight bike’s compliance characteristics may have offered a small mechanical efficiency advantage. The aero bike’s vertical stiffness was likely not optimally matched to the test surface, allowing greater energy losses.
Gaining Efficiency Through Seatpost Compliance
This information is quite encouraging because it suggests you may be able to fit a more compliant seatpost to your road bike and gain a small but measurable efficiency benefit. And the bigger benefit? Much more ride comfort.
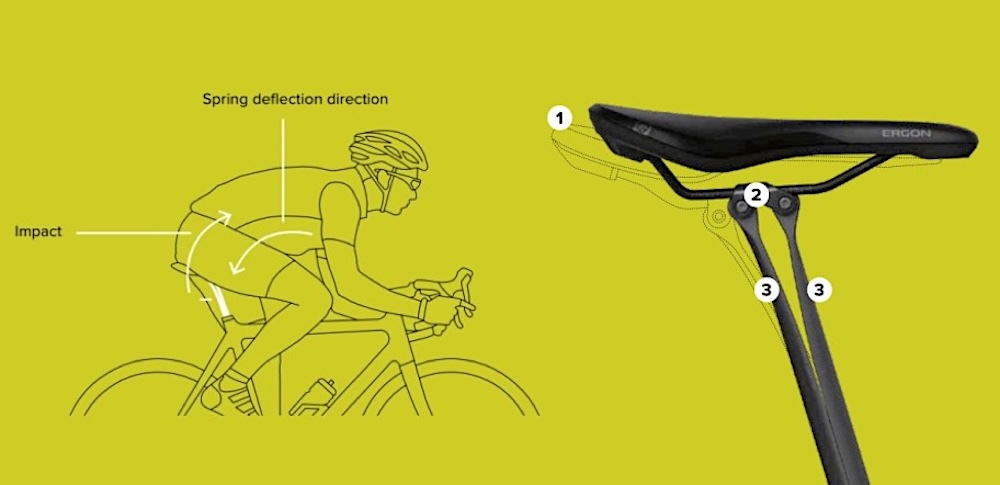
Orbea specifically engineers the carbon layup of its seatpost on the lightweight bike to deliver controlled vertical flex, helping to absorb vibrations and impacts. Compared to the oval seatpost on the aero bike, the difference in vertical compliance is substantial.
Many other carbon seatposts are also designed to flex. Examples that deflect under low force and fit 27.2 mm seat tubes include the Ergon Allroad Carbon Pro, Roval Terra, Schmolke Carbon TLO and Canyon SP0057 VCLS. The Ergon is a favourite of ours, you can check out our review HERE.
This data also raises an interesting point for aero bike design. Brands may be able to introduce more vertical compliance into aero frames and seatposts to claw back a small amount of mechanical efficiency.
According to data published by Tour Magazin, the vertical compliance on the Scott Foil measures 130 N/mm, while the Cervelo S5 measures 326 N/mm, 2.5 times as stiff vertically. Although the S5 has been tested as faster aerodynamically at 40 km/h, it’s possible that the greater vertical compliance of the Foil could narrow the real-world performance gap, or even offset some of the aerodynamic advantage under certain conditions.
Of course, whether that happens would depend on surface roughness, tyre choice, pressure, and rider input. But it highlights that aerodynamics isn’t the only factor influencing overall speed, especially when it comes to marginal gains.
When Does Seatpost Compliance Go Too Far?

You might be wondering when a seatpost becomes too compliant.
A recent Pedalling Efficiency Rig test comparing suspension vs rigid seatposts showed that while a suspension post can be faster on rough surfaces by as much as 13 to 14 watts, it actually slows you down on smooth roads.
This demonstrates that the ideal level of seatpost compliance varies with rider weight and surface texture. Go too soft, and you’ll sacrifice efficiency on smooth roads; go too firm, and you’ll also lose efficiency on smooth roads.
In the end, the right amount of seatpost compliance will need to be tailored to your body weight and the surfaces you ride most often. Unfortunately, right now, we don’t have enough data to fully understand all the subtle effects.
Why Seatposts Offer More Compliance Than Frames and Tyres
The seatpost plays a key role in vertical compliance, usually more so than the frame itself. It functions as a cantilevered beam, with the rider’s weight applied at its unsupported end, making it far more prone to vertical deflection than the rear triangle of the frame.
By contrast, a traditional double-diamond frame is inherently stiff in the vertical plane thanks to its triangulated design, so any vertical compliance in the frame is typically minimal compared with a long, exposed seatpost.
In structural terms, the seatpost’s leverage and geometry allow it to dominate vertical compliance, while the frame largely resists it. That doesn’t mean the frame contributes nothing, but mechanically, the seatpost is usually the primary component through which compliance can be gained.
A seatpost can be even more compliant than your tyres. Some seatposts deflect a vertical millimetre with as little as 61 N force, though ~120 N is more typical for a road bike with a round seatpost. In comparison, a 28 mm tyre at 87 psi deflects the same distance with 167N force. This ultimately means that a seatpost is likely doing more than you think for the system compliance of your road bike.
Note: I’ve gathered vertical stiffness data for many bike components, and you can read more about the measurements HERE.
Putting 3 Watts into Perspective

I do need to put into perspective the potential 3 watts gained by using a seatpost with more compliance.
At typical endurance power outputs, 3 watts on a flat road equates to roughly 0.15 to 0.2 km/h more speed. This is similar to the variation between chain lubricants and smaller than the rolling resistance gap between many tyre models.
More importantly, it’s far less than the aerodynamic savings from position changes on the bike. For example, riding with flatter forearms (pic) and a lower position can save in the region of 35 watts at 45 km/h, according to AeroCoach. That’s more than 10 times the measured efficiency difference to seatpost compliance.
Separate aerodynamic testing by Cycling News suggests the gap between a traditional round-tube road bike with round handlebars, external cables, and shallow box-section wheels, and a fully optimised aero road bike, can be as much as 27.5 watts at 40 km/h. Even if you subtract the 3-watt mechanical efficiency difference, the fully optimised aero bike with not enough seatpost compliance would still hold roughly a 24.5-watt advantage.
At 30km/h, however, the aerodynamic gains shrink. The difference between a completely unoptimised and fully optimised aero setup is likely closer to 11 to 12 watts at that speed. Subtract 3 watts, and you’d be left with just an 8 to 9-watt advantage for the aero bike.
In any case, the biggest benefit of more seatpost compliance is likely the extra comfort it offers.
Does Increased System Compliance Matter for Pros?

The data we currently have comes from relatively low power outputs, around 130 to 310W. This range is highly relevant for most everyday riders and even elite athletes riding in their endurance zones.
But what about higher outputs? Could additional system compliance start to reduce mechanical efficiency at 500 W, or even 1000 W?
Ultimately, more testing is needed to identify any potential inflection points. The good news is that high power outputs (1000 W+) typically occur while standing, meaning the seatpost has little to no impact on mechanical efficiency in those situations.
Understanding the Limits of Lab-Based Efficiency Testing
Before we wrap things up, it’s also worth highlighting a few important limitations of this lab testing.
First, we weren’t given detailed information on measurement error, standard deviation, repeatability, or the calibration protocol used for the test rig. If the system’s accuracy is ±2 watts, then a reported 3-watt difference sits only marginally above the noise floor. Without published error bars or repeatability data, it’s difficult to determine how statistically meaningful the difference truly is.
Second, the scope of the testing was narrow. To strengthen the conclusions, we would ideally want to see results replicated across multiple riders (with different pedalling styles and masses), different bike and seatpost designs, and a range of tyre pressures. Small setup variations can meaningfully influence system losses, and a broader dataset would help determine whether the observed difference is universal.
Finally, it’s important to recognise what this test does not measure. The rig isolates mechanical losses within the bike system itself, but it cannot account for rider comfort, muscle recruitment changes, or neuromuscular fatigue over time.
In real-world conditions, improved compliance may reduce muscular strain and help a rider sustain power for longer. This is a performance variable that doesn’t appear in a short-duration mechanical efficiency test.
Summary
This lab test comparing an aero and lightweight road bike revealed small but consistent efficiency differences, with the more compliant bike transferring slightly more rider power to the rollers across all speeds and surfaces.
While the gap was modest, it suggests that vertical compliance in the seatpost may marginally reduce mechanical losses, even on smooth roads.
Although aerodynamics remains the primary performance driver for elite riders, these findings hint that controlled compliance could represent a subtle new avenue for marginal gains. And wouldn’t it be great to get a bit more comfort while we’re at it?
If you have a 27.2 mm seatpost, I’d definitely recommend fitting up a seatpost with engineered compliance. The Ergon Allroad Carbon Pro is a favourite of ours for its super smooth ride; you can check out our review HERE.


