

The most efficient bicycle drivetrain is usually one where the chain runs in a perfectly straight line – a singlespeed setup can achieve around 97% efficiency. In other words, 97% of the power you apply to the pedals goes directly into turning the rear wheel.
Once derailleur gears are introduced, however, the chain must bend and articulate as it moves across the cassette cogs, increasing friction and reducing overall drivetrain efficiency.
The introduction of wide-range rear cassettes (e.g. 10–42T or 10–52T) has allowed riders to eliminate the front derailleur while keeping a similar total gear range. 1X drivetrains help reduce bike weight, simplify maintenance, and give frame designers more freedom to increase tyre clearance by removing the need to accommodate a front derailleur.

That said, one of the main drawbacks of 1X systems is the sharper chain angles required to reach the largest and smallest cogs. This results in greater chain wear and higher frictional losses. By contrast, a 2X drivetrain maintains a straighter chainline, since the smaller chainring can be used with the larger cassette cogs and the larger chainring with the smaller cogs.
So, how much more friction does a 1X drivetrain actually produce compared to a traditional 2X setup?
In May 2019, VeloNews partnered with CeramicSpeed to measure the frictional differences between 1X and 2X drivetrains. In the following sections, we’ll examine their testing protocol, review the results, and then crunch some numbers to see how these frictional losses actually translate into real-world cycling speed.
Note: This article was originally published in June 2019 but has been updated in October 2025 with more recent information.
The Test
VeloNews and CeramicSpeed compared two drivetrain configurations to quantify the frictional differences between 1X and 2X systems:
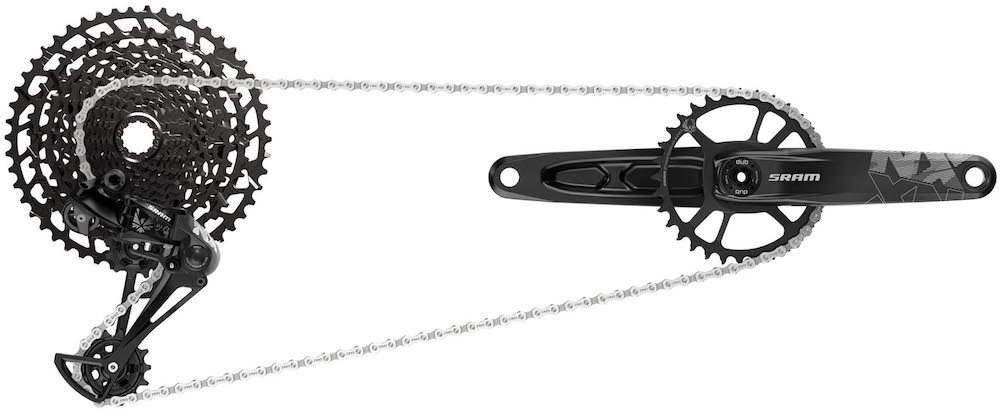
- 1X drivetrain: SRAM Force 1 rear derailleur, 48-tooth narrow-wide chainring, PC-1170 chain, and a 10–42T cassette
- 2X drivetrain: Shimano Ultegra rear derailleur, 53/39T chainrings, HG701 chain, and an 11–34T cassette
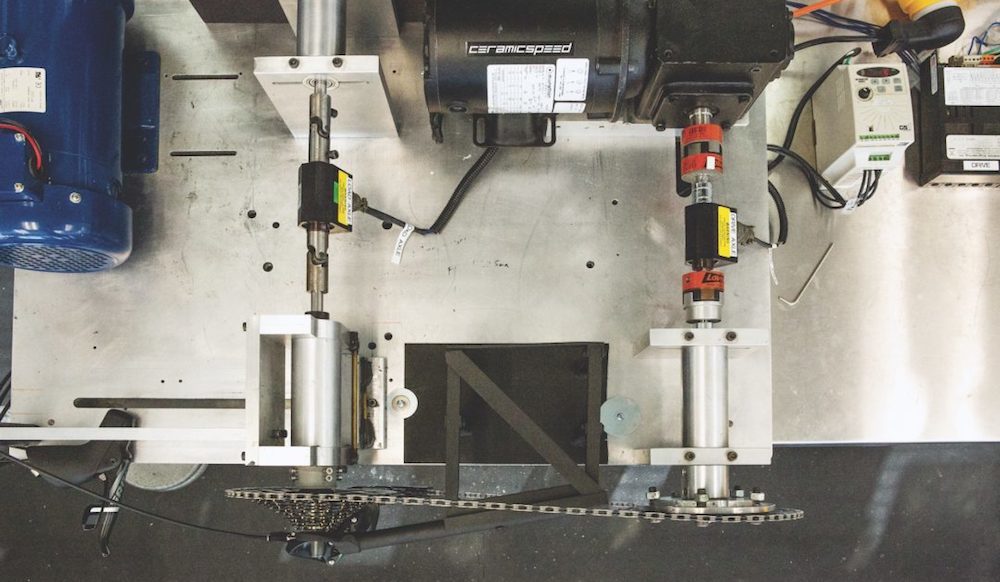
These setups were chosen because they provide nearly identical gear ranges, allowing for a direct comparison of frictional losses at equivalent ratios. Both drivetrains were mounted on a test machine capable of precisely measuring drivetrain losses across all gear combinations. The rig simulated a 250-watt rider output at a cadence of 95 RPM.
To ensure fairness, the chainlines were matched as follows:
- The 1X drivetrain had a straight chainline in the 5th smallest cassette cog.
- The 2X drivetrain was aligned from the 53T chainring to the 5th smallest cog, and from the 39T chainring to the 8th smallest cog.
CeramicSpeed also standardised the lubrication procedure by removing the factory lubricants and applying the same mineral oil to both chains. Each drivetrain was run for the same test duration.
Note: Previous CeramicSpeed testing found no additional friction when using 1x narrow-wide chainrings compared to standard 2x chainrings, and no measurable difference between derailleur pulley systems.
The Results
The VeloNews/CeramicSpeed testing revealed several key insights into how drivetrain configuration affects efficiency:
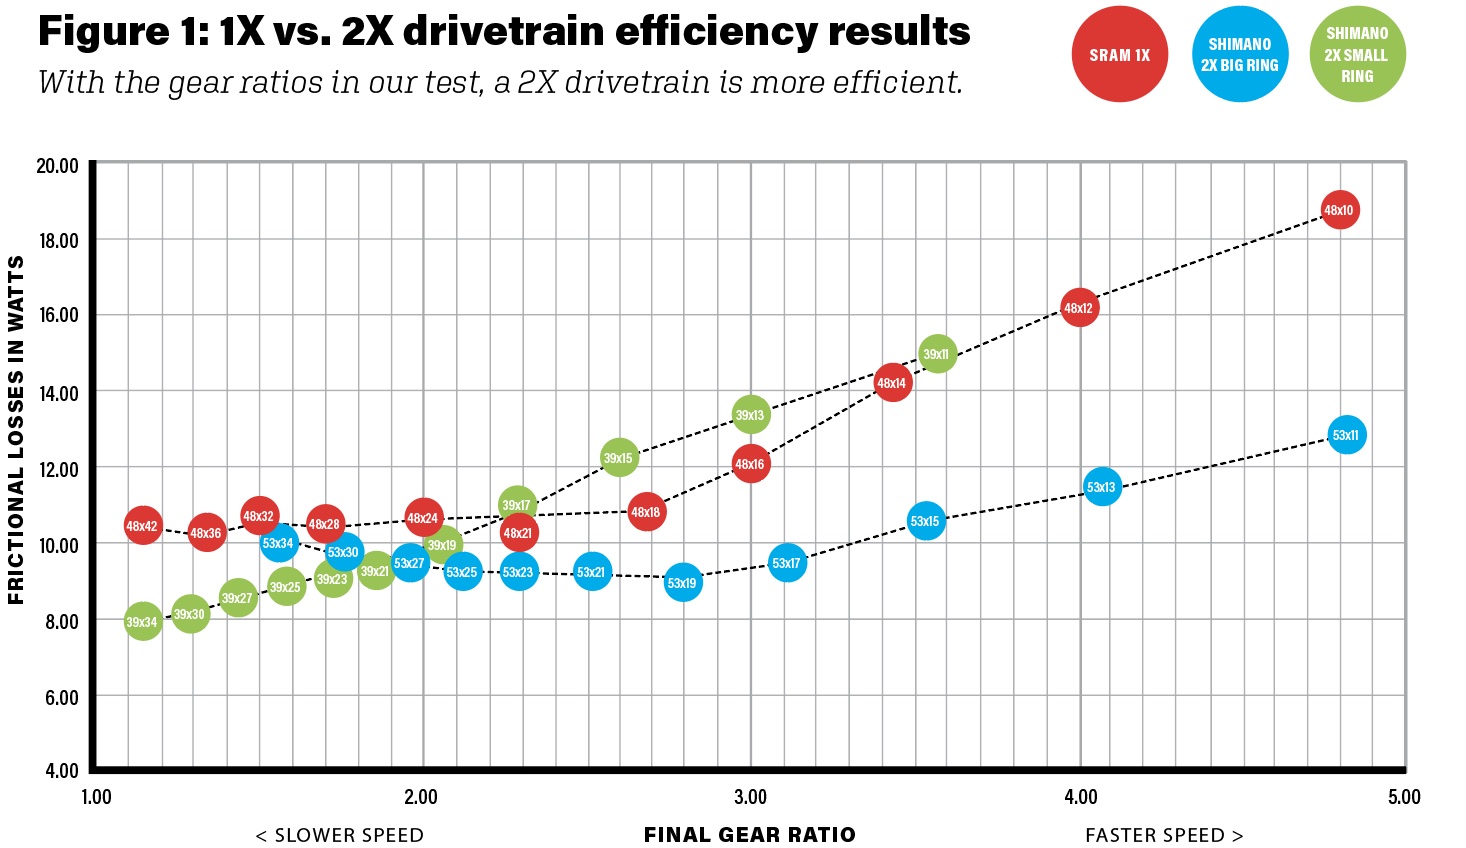
- Frictional losses generally increase as you move up through the gear ratios (toward smaller cassette cogs).
- The 2X drivetrain proved to be more efficient in every gear, assuming the rider shifts to the large chainring after reaching 39x21T.
- The difference in frictional loss ranged from as little as 1 watt (48x21T vs. 53x23T) to as much as 6 watts (48x10T vs. 53x11T).
- Even with a perfect chainline, the 1x drivetrain (48x18T) exhibited more frictional loss than the 2x setup (53x19T).
- The 1x drivetrain efficiency ranged from 96.0% (best case) to 92.4% (worst case), averaging 95.1% efficiency overall.
- The 2x drivetrain efficiency ranged from 96.8% (best case) to 94.8% (worst case), averaging 96.2% efficiency overall.
CeramicSpeed calculated the average drivetrain friction by summing the power losses across all usable gears and dividing by the number of gears tested.
- The 1X drivetrain averaged 12.24 watts of frictional loss (across 11 gears).
- The 2X drivetrain averaged 9.45 watts of frictional loss (across 15 optimal gears).
That’s an average difference of roughly 2.8 watts, with the 2X drivetrain maintaining a measurable efficiency advantage across the entire gear range.
Why Is 1X Less Efficient Than 2X?
There are four main sources of drivetrain friction, and together they explain why a 1X system is inherently less efficient than a 2X.
- Chain Bend Angle
This is the most obvious factor. When the chain runs at an angle, it has to twist slightly as it engages the cassette cogs and chainring. The side plates rub harder against the teeth, increasing friction and wear. - Chain Tension
Chain tension depends on the size of the chainring and cassette cog in use. Smaller chainrings and smaller cogs create higher chain tension, which means the chain presses harder against the teeth — again, increasing frictional losses. - Chain Link Articulation
Every link in the chain has to pivot slightly at the pins as it wraps around each cog. On smaller cogs, the chain bends more sharply, requiring greater articulation and producing more internal friction at each pin interface. - Chain Speed
The smaller the cog, the faster the chain must travel to maintain the same wheel speed. This raises the number of tooth engagements per minute, which in turn increases overall friction.
Because of these factors, a 1X drivetrain suffers multiple disadvantages: it can’t maintain a perfectly straight chainline across its gear range, it operates under higher tension due to smaller chainrings, it forces greater articulation over smaller cogs, and the chain must run faster on those cogs.
This also explains why the 1X drivetrain consumes about 2 watts more than the 2X, even in the gear with a straight chainline. And interestingly, the 48x21T gear on the 1X setup showed the lowest friction, despite not being perfectly straight, because the benefits of reduced articulation and slower chain speed outweighed the losses from the slightly angled chainline.
What Is The Speed Difference Between Drivetrains?
Now, the fun part. We can translate those watts into real-world speed.
Using BikeCalc, I computed the speeds at 95 RPM on a 700C × 44 mm tyre, then fed the resulting power (which varies by gear from 231–242 W) plus rider+bike mass (85 kg) into Bike Calculator to see how the friction differences affect speed and time over 100 km.
Smallest Efficiency Gap (48×21T vs. 53×23T)
- Speed at 95 RPM: 29.12 km/h
- Power difference: 1 W in favour of the 2x setup
- Speed advantage: 0.06 km/h to the 2x drivetrain
- Time over 100 km: the 1x drivetrain is 25 seconds slower (~0.2%).
Highest Gear (48×10T vs. 53×11T)
- Speed at 95 RPM: 61.28 km/h
- Power difference: 6 W in favour of the 2x setup
- Speed advantage: 0.14 km/h to the 2x drivetrain
- Time over 100 km: the 1x drivetrain is 14 seconds slower (~0.3%).
Smallest Gear (48×42T vs. 39×34T):
- Speed at 95 RPM: 14.49 km/h
- Power difference: 2.5 W in favour of the 2x setup
- Speed advantage: 0.15 km/h to the 2x drivetrain
- Time over 100 km: the 1x drivetrain is 3 minutes 50 seconds slower (~0.9%).
Note: Based on my weight-testing, Bike Calculator gives results that line up closely with real-world experience.
How Do Derailleur Drivetrains Compare To Gearboxes?
We have efficiency data for several gearboxes – it’s not a perfect apples-to-apples comparison because the gearbox tests were run at 200 W while the derailleur data was at 250 W. If we conservatively assume derailleur efficiencies are the same at 200 W, we can get a reasonable picture of the real-world speed differences.
Average Efficiencies (assumed at 200 W)
- 2X Shimano Ultegra: 96.2%
- 1X SRAM Force 1: 95.1%
- Rohloff (14-speed hub): 94.5%
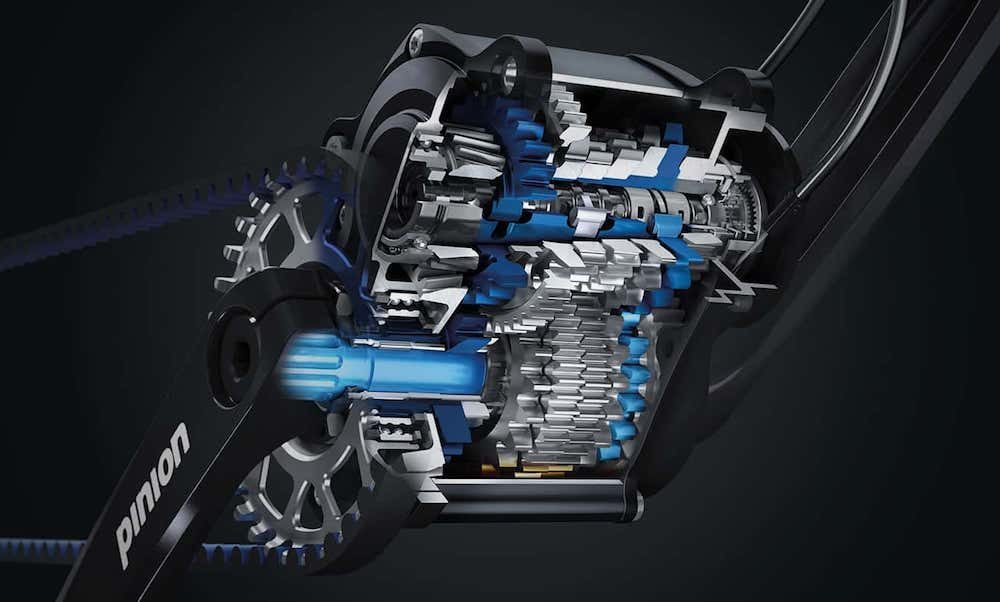
- Pinion (18-speed gearbox): 90.5%
Flat 100 km Route (0% gradient)
- 2x Shimano Ultegra: 31.13 km/h (baseline)
- 1X SRAM Force 1: 31.00 km/h – 52 seconds slower (~0.5%)
- Rohloff 14-speed: 30.92 km/h – 1 min 20 s slower (~0.7%)
- Pinion 18-speed: 30.41 km/h – 4 min 35 s slower (~2.3%)
Hilly 100 km route (five repeats of 10 km up / 10 km down at ~2% average gradient)
- 2x Shimano Ultegra: 28.8 km/h (baseline)
- 1X SRAM Force 1: 28.6 km/h – 1 min 10 s slower (~0.6%)
- Rohloff 14-speed: 28.5 km/h – 1 min 49 s slower (~0.9%)
- Pinion 18-speed: 27.9 km/h – 6 min 20 s slower (~2.9%)
Caveat: the gearbox tests showed efficiency improving with higher input power. If the gearboxes had been tested at 250 W, their efficiencies (particularly the Rohloff) would likely be higher – it’s plausible that the Rohloff could outperform the 1X SRAM Force 1 in the upper gears when tested at the same power.
Update: Shimano 105 12-Speed Test
To ensure our data aligns with the 2019 findings, I’ve gathered results from a recent drivetrain efficiency test conducted by CeramicSpeed and GCN at 250 watts. Their test primarily compared frictional losses between clean and dirty chains (1 W difference) and measured the added resistance from water (0.2 W) and sand (4 W).
They were surprised to discover that frictional losses varied far more between different gear ratios than between clean and dirty chains – or even with the added resistance of water or sand.
Their test setup featured a Shimano Ultegra 52T chainring, an 11–34T 12-speed cassette, a Shimano 105 Di2 rear derailleur, and a CeramicSpeed lower pulley and cage. I’ve estimated the efficiency values from the data shown in the video, so the numbers aren’t exact – but they should be close enough to provide a reliable comparison.
Of course, these results aren’t directly comparable to the VeloNews test, given the differences in test rig, chain lubricant, and drivetrain components. They should still reveal whether the overall efficiency trends remain consistent.

The frictional losses display a similar overall pattern to the earlier tests, with rear sprocket size remaining the primary factor influencing drivetrain friction. On average, the drivetrain experienced 8.9 watts of frictional loss, corresponding to a 96.4% drivetrain efficiency at a 250-watt power output.
At 7 watts, the losses in the smallest gear (52x34T) are slightly lower than those recorded in previous drivetrain tests – a difference that could easily be attributed to the type of lubricant used or the CeramicSpeed pulley and cage. Conversely, losses are a bit higher in the largest gear (52x11T), perhaps due to the slightly smaller front chainring in this setup.
Overall, these findings support the reliability of the drivetrain resistance data from the VeloNews test.
Does Drivetrain Efficiency Really Matter?
In short, only a little.
To put the 0.3–0.9% slower speeds of a 1X drivetrain into perspective, here’s how that compares to other common cycling variables:
- 7.9% slower when using four panniers instead of bikepacking bags
- 5.4% slower when using Schwalbe Marathon Mondial tyres instead of Schwalbe Almotions
- 3.2% slower when carrying 30 kg of extra luggage on flat terrain
- 1.5–2.7% slower when a dynamo hub is switched on vs off
If you spend most of your time in low gears, the efficiency gap is most noticeable. In the smallest gear, the 1X drivetrain is roughly 0.9% slower, adding about 3 minutes and 50 seconds over a 100 km ride.
At higher speeds, air resistance dominates, making drivetrain friction far less important. In the highest gear, the 1X system is just 0.3% slower, or about 14 seconds over 100 km – barely measurable in real-world conditions.
And when the chainline is nearly straight, drivetrain efficiency between 1X and 2X differs by only 1 watt, translating to a mere 0.2% speed gap – about 25 seconds over 100 km.
In other words, while 2X drivetrains are technically more efficient, the difference on the road is almost negligible compared to the impact of tyres, luggage, or aerodynamics.
Click HERE To Check Out My Weight Testing, HERE For The Tyre Resistance Testing and HERE To See My Aero Testing


