

For years, I’ve been on a mission to understand what truly makes a bike feel comfortable. To keep things objective, I’ve been collecting vibration data to evaluate bikes and components more accurately.
Initially, I used a smartphone with a vibration app to measure how bumpy different bikes felt on various trails. That worked surprisingly well, but I’ve now upgraded to a much more precise system.
My New Vibration Measurement Procedure
I now use controlled obstacles combined with a high-resolution accelerometer to measure vibrations directly on the bike. This approach delivers results that are:
- Consistent regardless of weather (hot, cold, dry, or wet)
- Easy to compare across different days, making benchmarking more reliable
- Measured directly on the bike, removing the rider’s body as a damping factor
- Collected at real-world gravel riding speeds (20–25 km/h)
Best of all, these results align closely with my earlier outdoor and treadmill tests, confirming their reliability.
Front and Rear Vibration Measurements
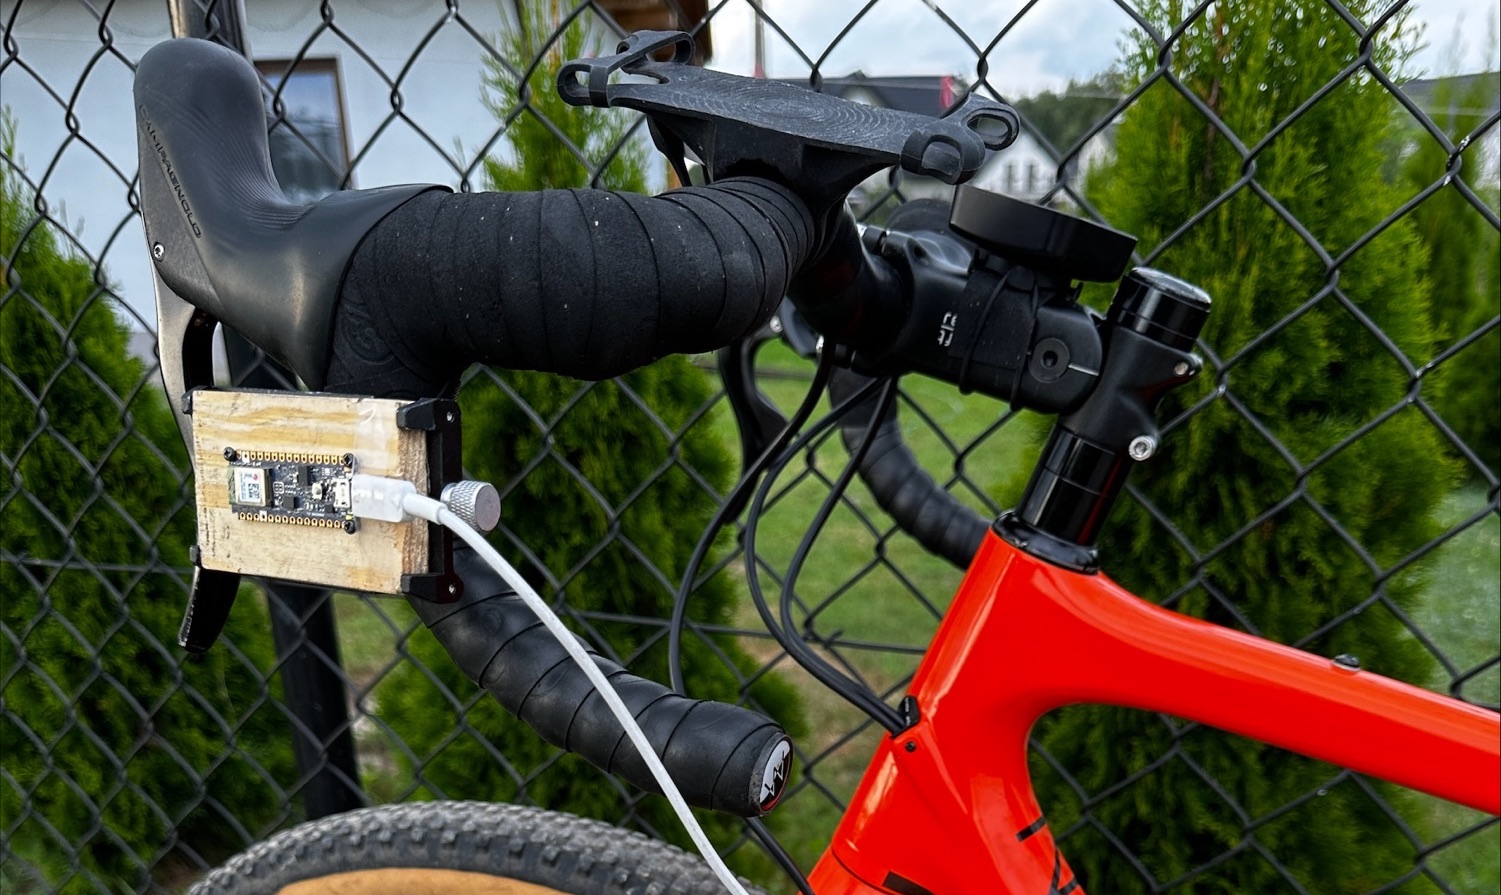
I use an Arduino Nano BLE 33 accelerometer, powered by USB, to collect detailed vibration data at 500 Hz. With help from the developer of this Vibration Analysis app, I’ve fine-tuned the setup for comfort testing.
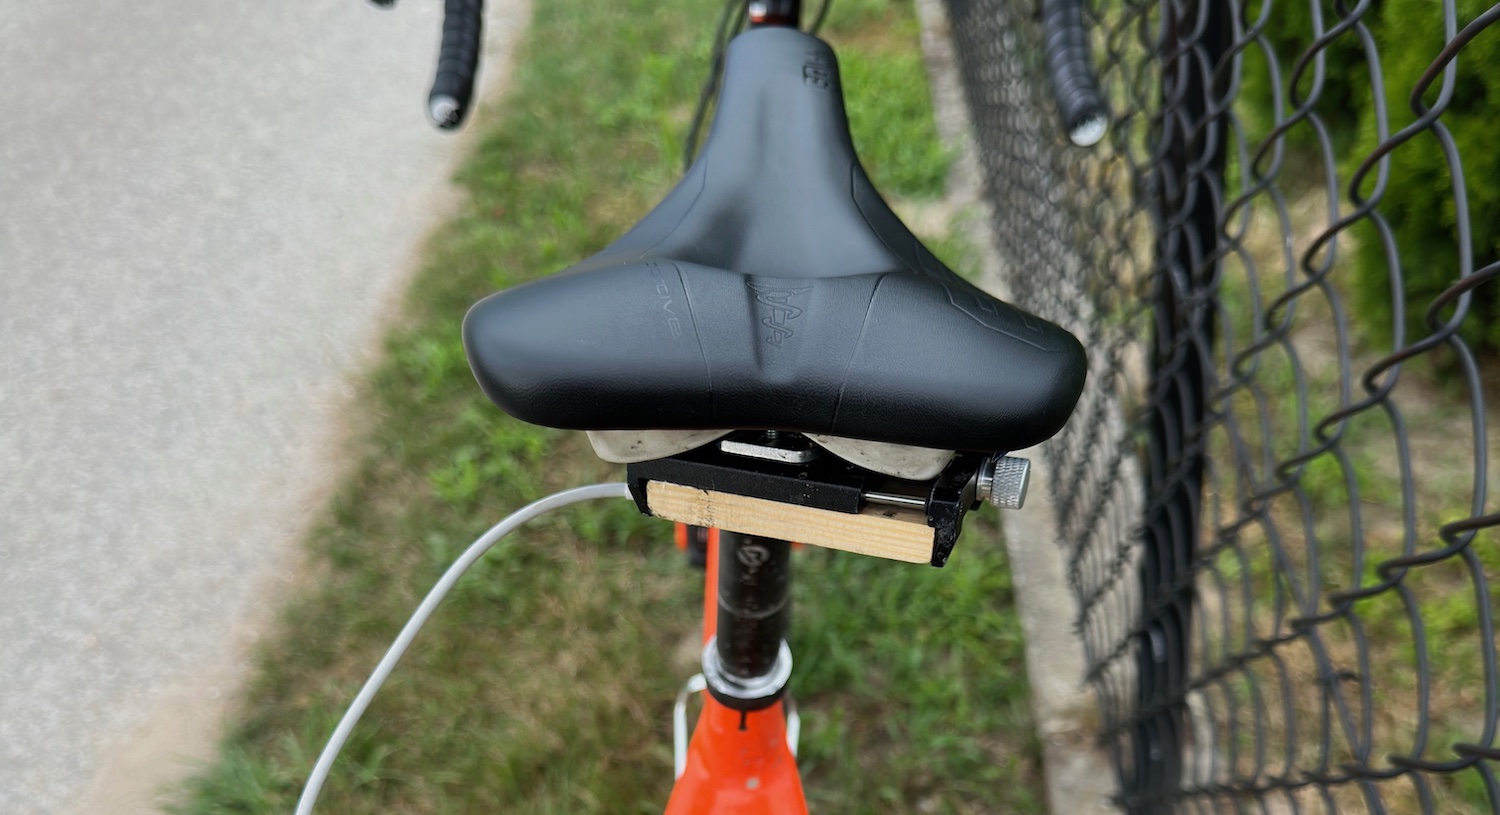
The sensor is mounted under the brake hoods and saddle, so we measure the bike itself – not the rider. This gives a clear picture of front and rear comfort without the body absorbing or masking vibrations.
Single Hit Test
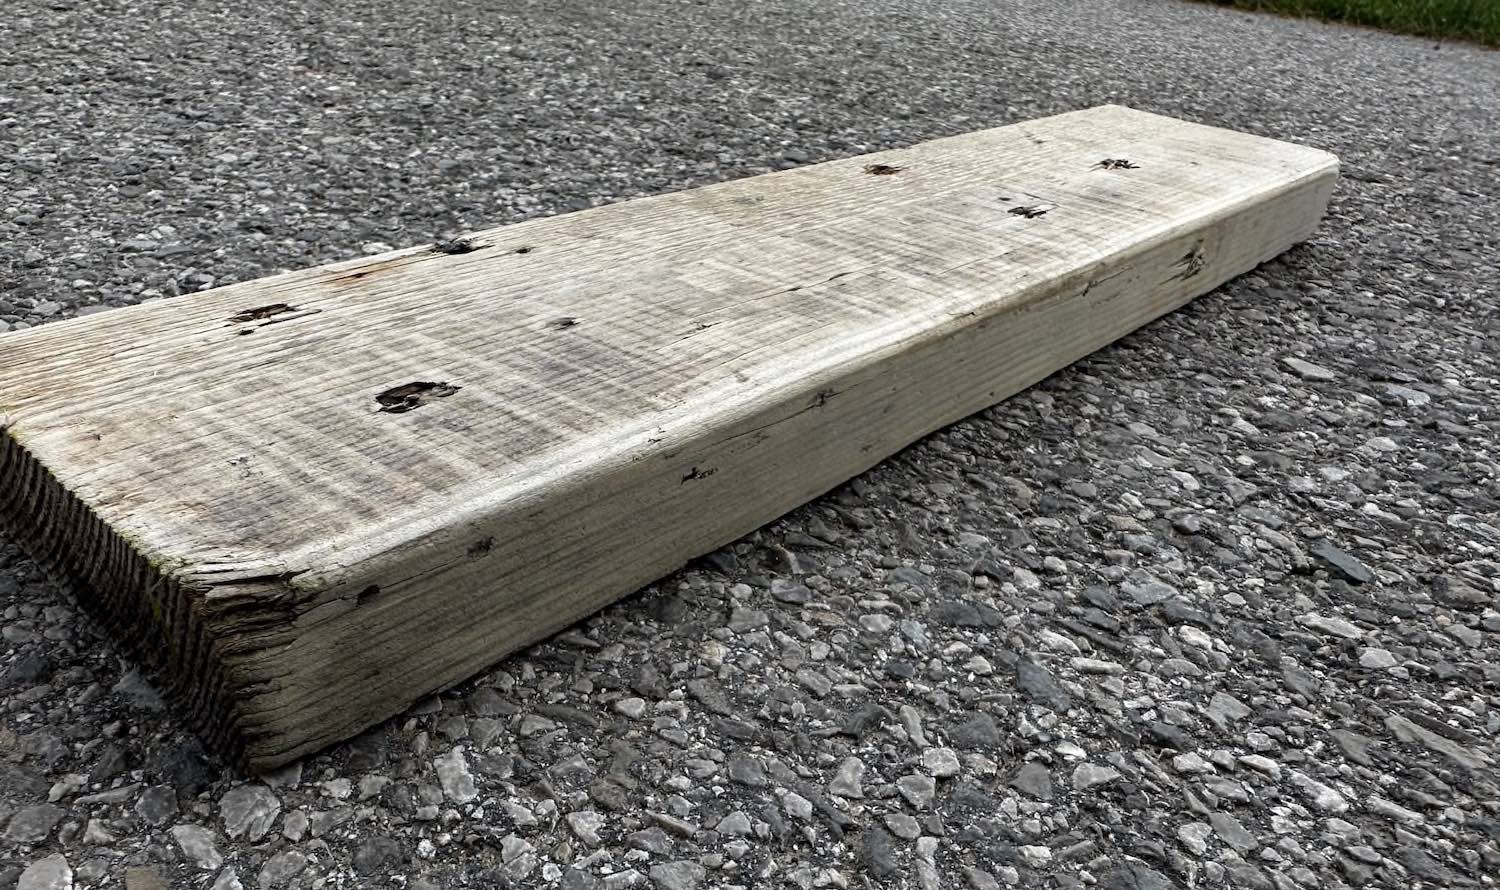
To evaluate a bike or component on a single large impact, I place a wooden block (50 mm long, 30 mm high) on smooth asphalt. Riding over it at 20 km/h while seated (no pedalling) captures one clean bump event.
Fast Gravel Road Test
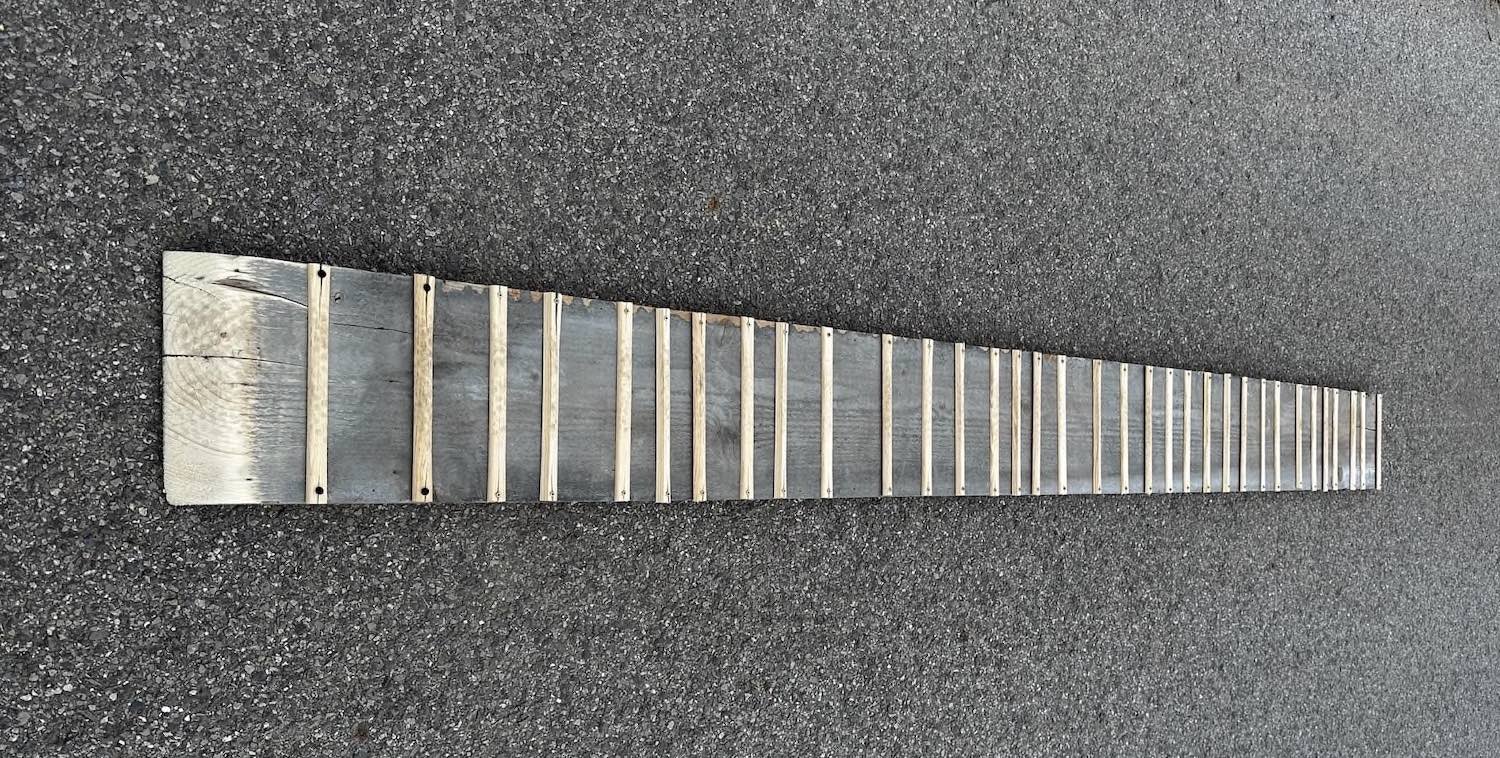
To simulate fast gravel chatter, I use a 3 metre long obstacle with 34 wooden slats spaced randomly. This creates a short series of bumps that mimics a real gravel road.
I ride over it at 25 km/h, staying seated and not pedalling, while recording vibration data.
This test also includes a larger impact right at the start (when I first roll onto the obstacle), so it doubles as a broader performance test. I skip the data from the end of the obstacle since the drop-off isn’t consistent across runs.
Multiple Test Runs
Each obstacle is tested nine times. To reduce the effect of minor speed variations, I discard the two highest and two lowest readings, averaging the remaining five runs – the data you see in the results.
Summary
Our controlled obstacle results align closely with actual gravel road and singletrack data, giving confidence in the consistency of this approach.
The data is easy to collect, repeat, and compare at real-world riding speeds, providing a clear picture of how different bikes and components affect comfort on a gravel bike.


